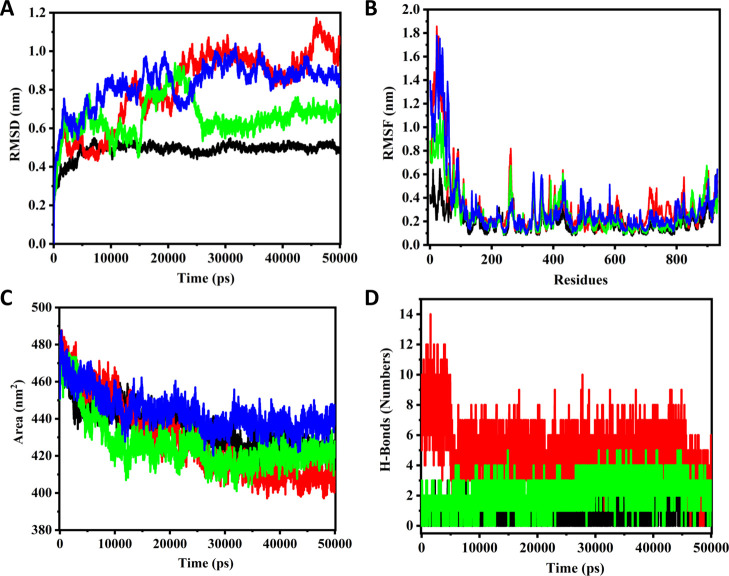
Figure 5.
MD simulations for the native RdRp and its GTP-bound, FIH-bound, and the lead optimized compound-bound complexes. (A) Comparative rmsd plots of the native and ligand-bound complexes for a 50 ns time period. (B) Comparative RMSF plots of the native and ligand-bound complexes for a 50 ns time period. (C) Comparative SASA profiles of the native and ligand-bound complexes. (D) Comparative H-bond interactions of the GTP, lead optimized, and FIH compound complexes for 50 ns. (black curve—FIH; red curve—GTP; green curve—lead compound; and blue curve—native protein).

