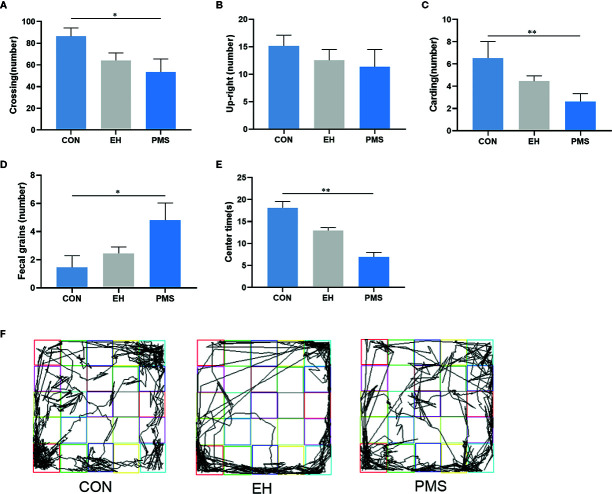
Figure 3.
In the open field, PMS group had reduced number in upright, carding and fecal grains compared with other groups. (A): the number of crossings in the OFT. (B): the number of upright in the OFT. (C): the number of carding in the OFT. (D): the number of fecal gains in the OFT. (E): the time at the center state in the OFT. Values are expressed as the mean ± SEM (n= 11 rats per group). Representative diagrams of the pathways in the OFT from each group, and (F) showed the rats’ mobile trajectory Figs in CON, EH and PMS group. *p < 0.05, **p < 0.01.

