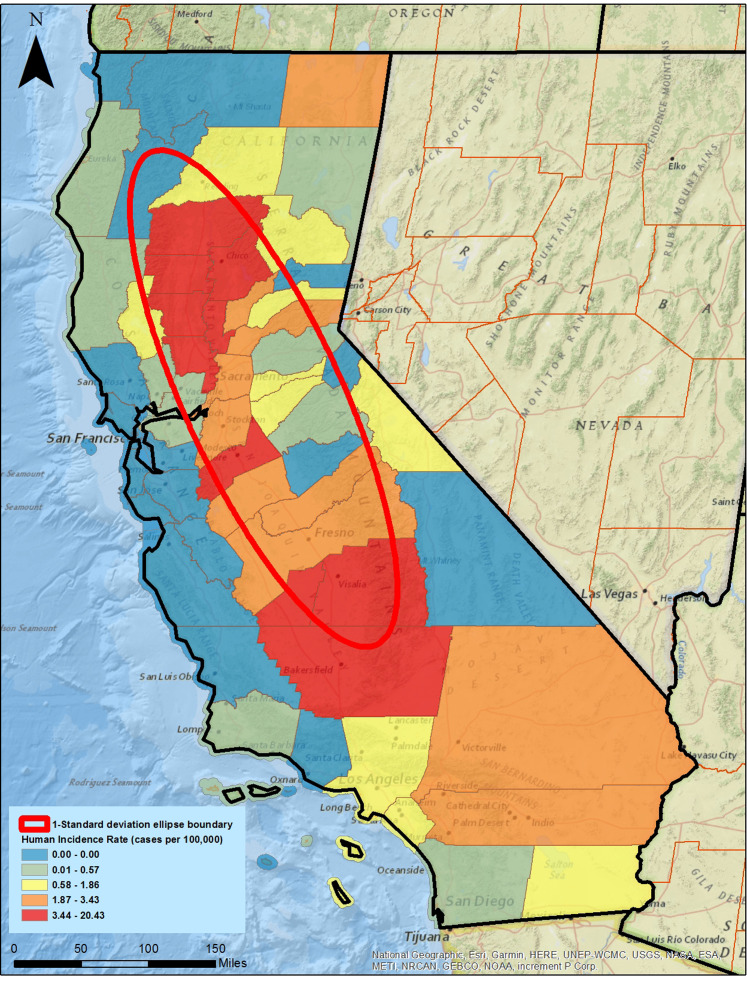
Figure 3. West Nile Virus human incidence rate by county with a 1-standard deviation ellipse superimposed.
California has 58 counties; 31 counties are contained within or intersect with the 1-standard deviation ellipse. Colors represent quintiles of reported human incidence of WNV. Built using ESRI ArcGIS® and ArcMap™ basemap files (ESRI, Redlands, CA, USA). Sources for basemap: National Geographic, Esri, Garmin, HERE, UNEP-WCMC, USGS, NASA, ESA, METI, NRCAN, GEBCO, NOAA, increment P Corp.

