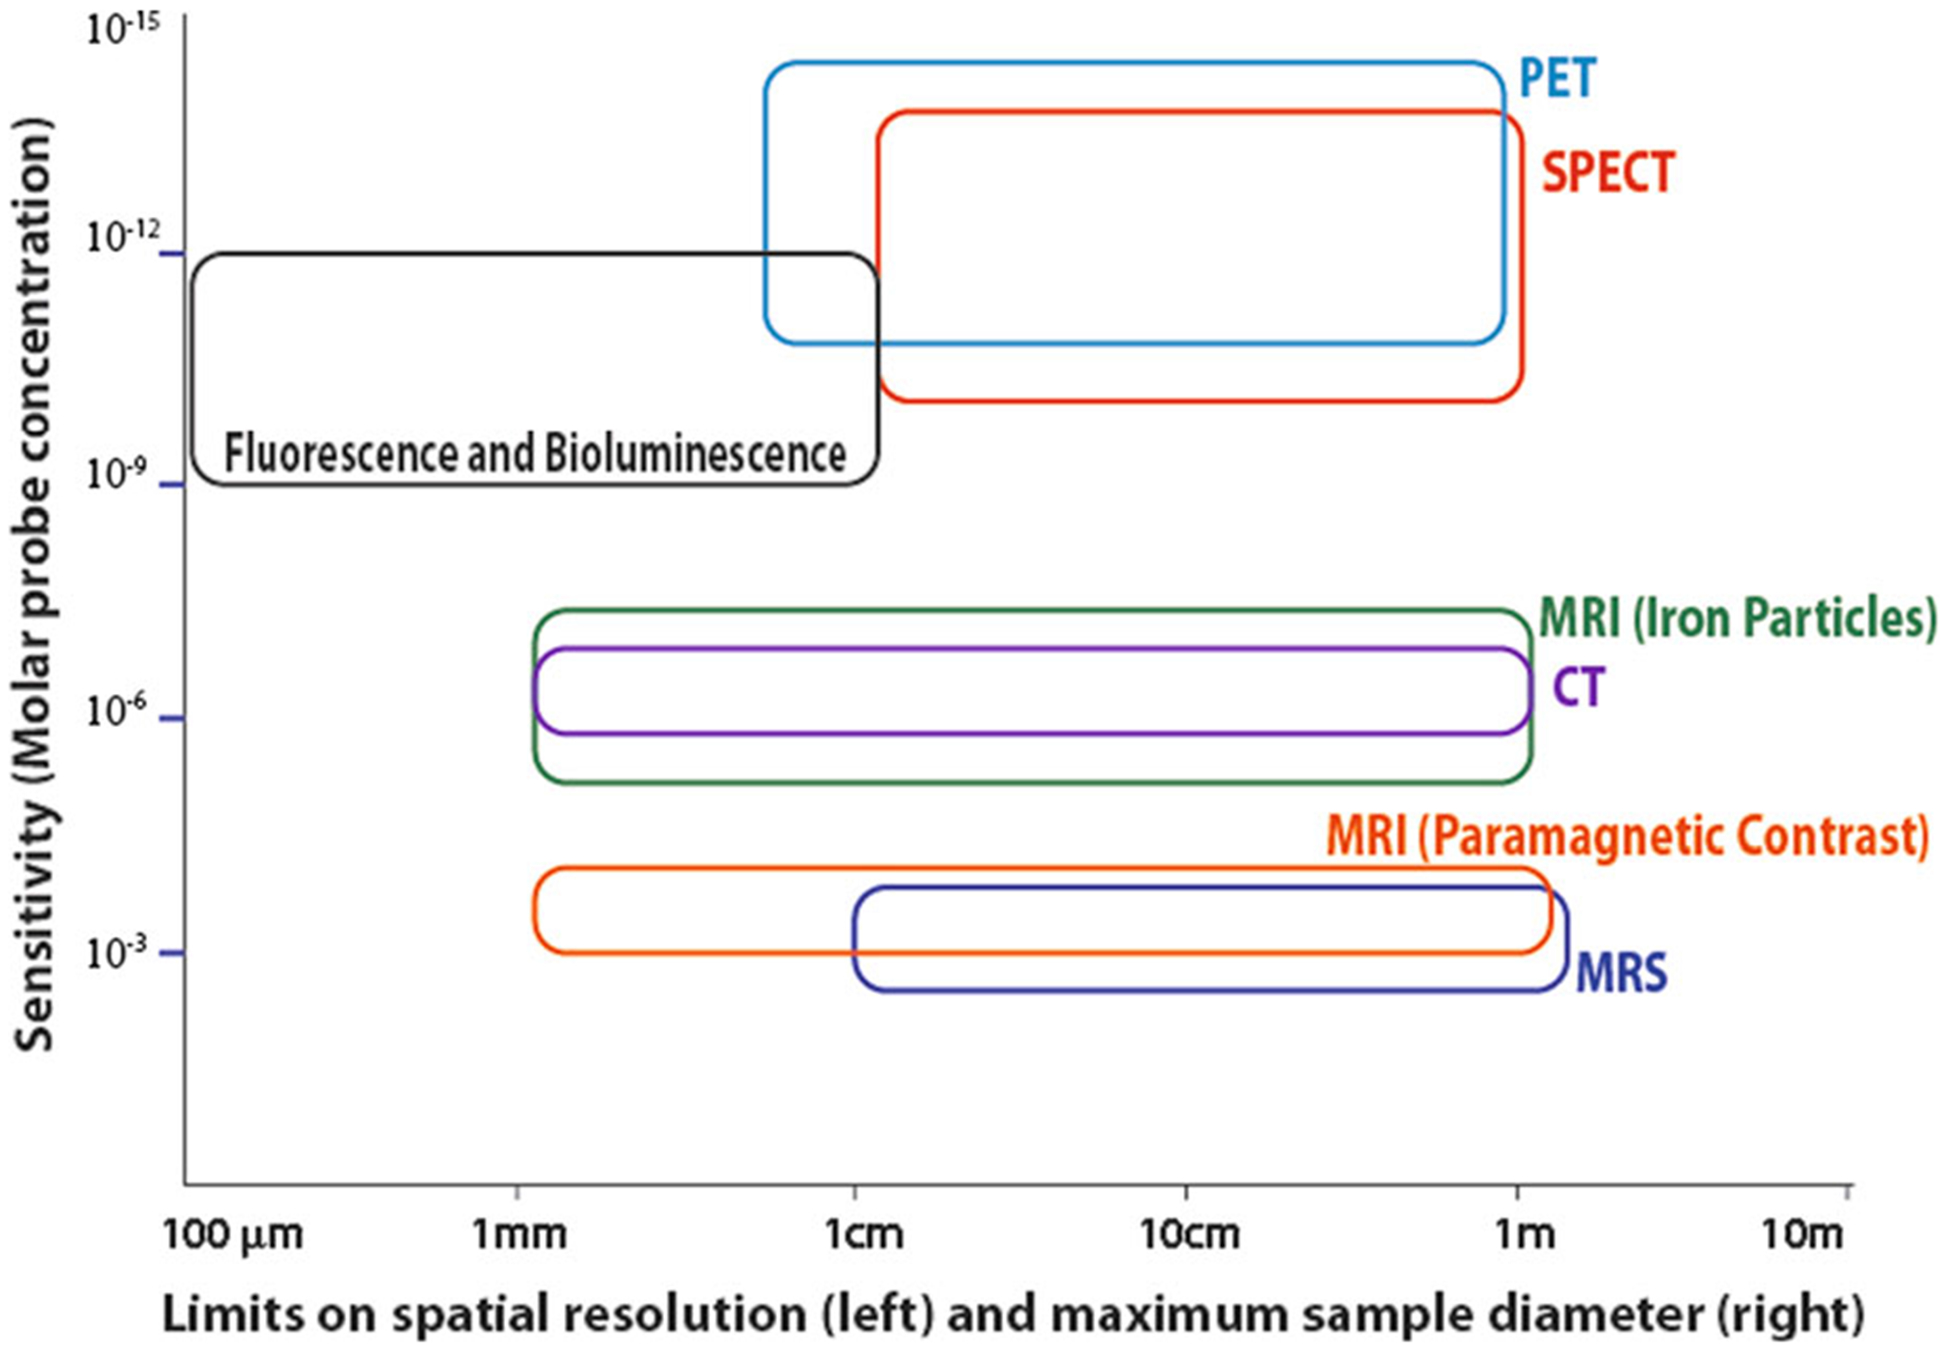
Figure 2.

Comparison of the capability of different large animal and human molecular imaging modalities. This figure uses a log-log scale of sensitivity on the vertical axis and spatial resolution on the horizontal axis to demonstrate the capabilities of several imaging modalities. The limit on spatial resolution is shown as the left edge of each shape, while the approximate maximum sample size, which is dependent on both instrument design and signal attenuation, is shown as the right edge. The height of each shape shows the range of sensitivity estimates. This figure was first published by Goldhawk et al, using data from several sources and is used with permission.87,135–137,151–154.
