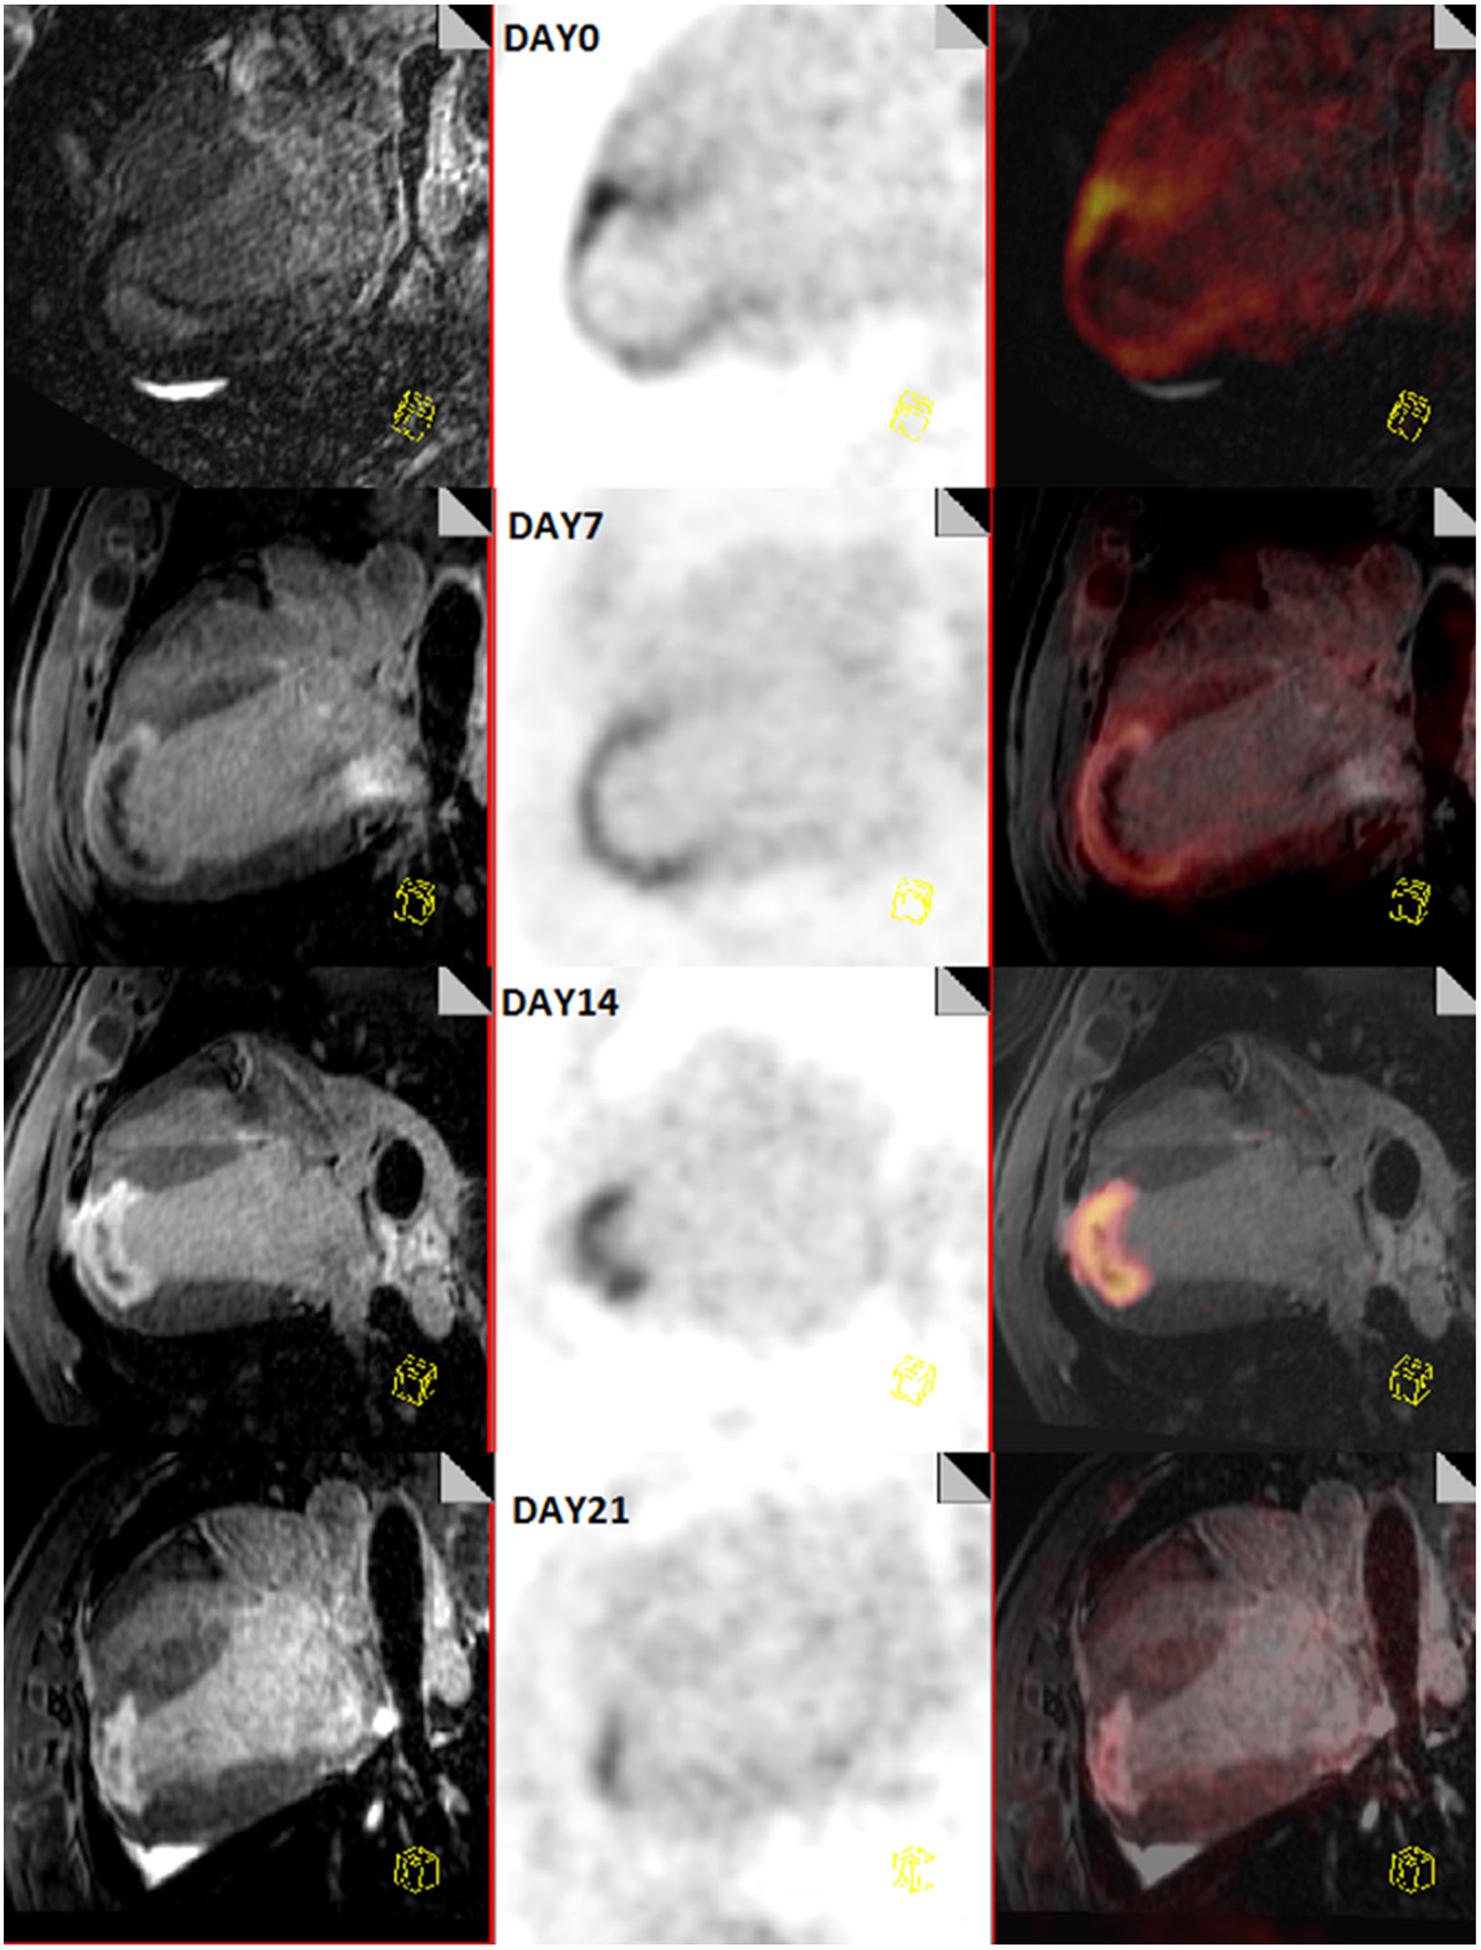
Figure 3.

Longitudinal comparison of inflammation post-MI with PET/MR in a canine model. This figure shows the progression of a myocardial infarction from day 0 (top) to day 21 (bottom). On the left are a multiplanar reconstruction of 3D T1-weighted images showing a 4-chamber view of the heart, acquired 20 minutes after a bolus injection of Gd-DTPA, in the middle is an 18F-FDG image and on the right is a combined PET/MR image. Myocardial glucose uptake is suppressed by lipid infusion and heparin injection. These images show that the areas of inflammation decrease over time.
