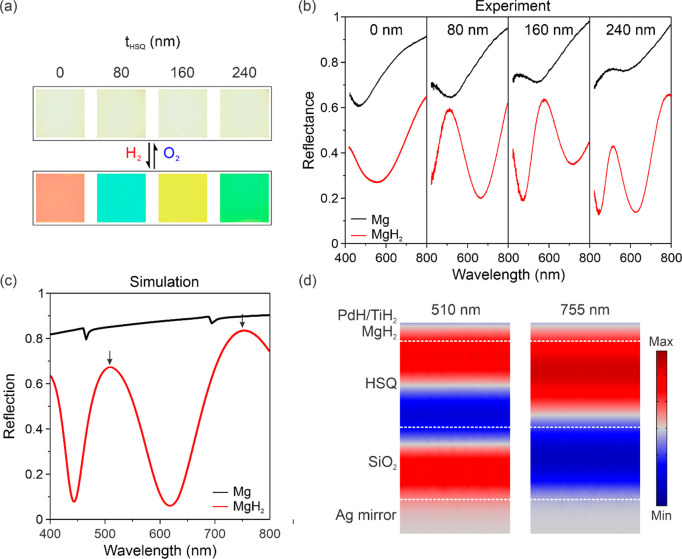
Figure 3.
Experimental results of dynamic color display. (a) Optical microscopy images and (b) experimental reflectance spectra of the stepwise pixels with different heights, tHSQ = 0, 80, 160, and 240 nm before and after hydrogenation. (c) Simulated reflectance spectra of the pixel (tHSQ = 240 nm) before and after hydrogenation. (d) Electric field distributions at the different FP resonances (see the black arrows in (c)) after hydrogenation. Third- and second-order FP resonances are excited at 510 and 755 nm, respectively.

