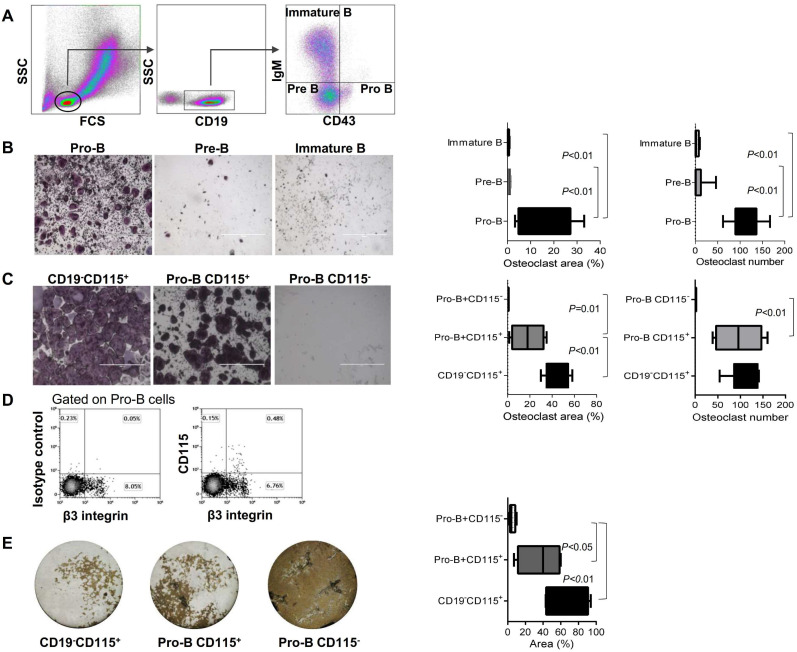
Figure 2.
Lymphoid-osteoclastic differentiation is restricted to CD115+ Pro-B cells. (A) Definition of BM B cell precursor populations by flow cytometry using CD19, surface IgM (IgM) and CD43 antigens. Note, all CD19+ cells were also B220+ (B, C) TRAP staining of osteoclasts derived from the indicated sorted BM cells. Plots represent the percentage of osteoclast area (left) and osteoclast number (right); (B) Left panel - osteoclast differentiation from sorted Pro-B cells (B220+CD19+CD43HighIgM), middle - Pre-B cells (B220+CD19+CD43LowIgM-) and right - immature B cells (B220+CD19+CD43-IgM+)(180,000 cells/well); (C) TRAP staining of osteoclasts derived from the indicated BM sorted cells (10,000 cells per well). Left -positive control of monocyte lineage (CD19-CD115+). Middle - Pro-B cells expressing CD115. Right - Pro-B cells negative for CD115. n = 5-9 mice in each group; (D) Expression of β3 integrin (CD61) by CD115+ Pro-B cells (E) Pit resorption area from the indicated sorted cells (10,000 cells per well) cultured on calcium phosphate-coated 96-well plates with M-CSF and RANKL. Left - positive control of monocyte lineage (CD19-CD115+), stopped after 5 days in culture. Middle - Pro-B cells expressing CD115, and right - Pro-B cells not expressing CD115, stopped after 8 days in culture. Note that white area indicates bone resorption while the brown regions are negative for osteoclast activity. Representative images were acquired at x4 magnification. Values in the scatter plot represent the quantification of the pit resorption area (resorbed area is white and non-resorbed is brown). For (B), (C) and (E) the p values were calculated by 1-way ANOVA with Bonferroni post-hoc test. In the “Box and Whisker” plots error bars represent 5-95 percentile range.

