Figure 1.
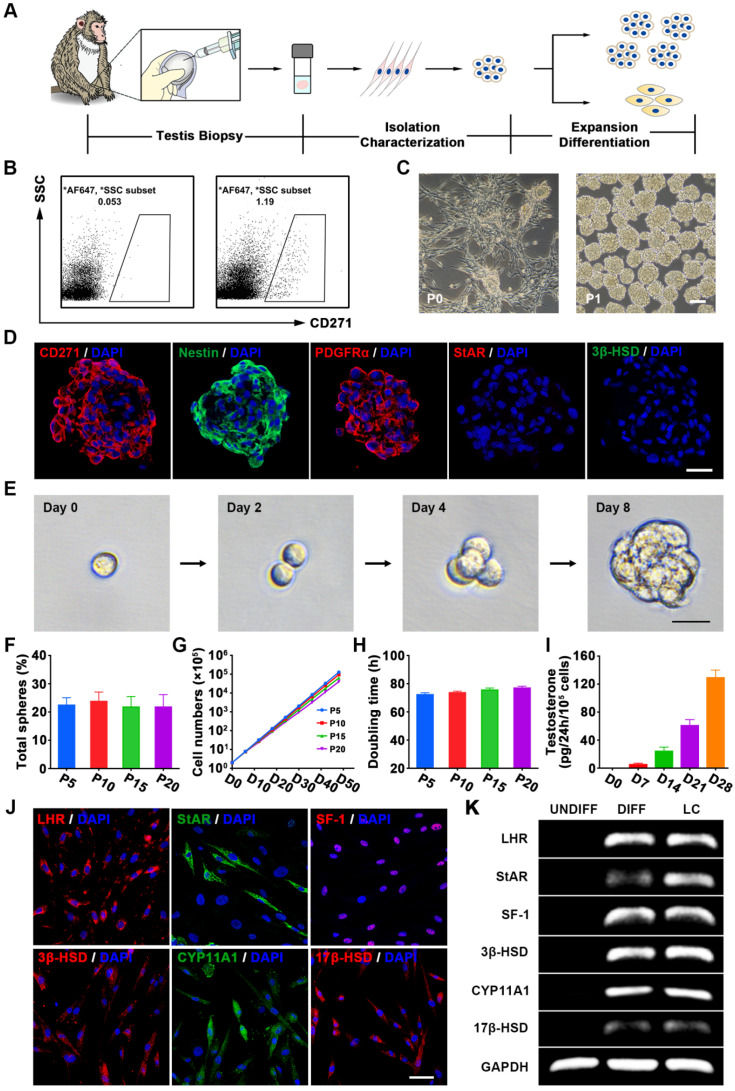
Characterization of CM-SLCs from the testes of cynomolgus monkeys with TD. (A) Schematic of the experimental procedure used to identify CM-SLCs. (B) Flow cytometry was used to isolate CD271+ cells from the testes of cynomolgus monkeys with TD. Left: isotype controls. Right: stained samples. SSC: side-scattered light. (C) Phase-contrast micrographs of CM-SLCs in primary culture (P0) and passage 1 (P1). Scale bar, 100 µm. (D) Cultured CM-SLCs spheres express CD271, Nestin and PDGFRα but not StAR or 3β-HSD. Nuclei were counterstained with DAPI (blue). Scale bar, 25 µm. (E) Representative images showing clonal sphere growth from single cells, as observed using a bright-field microscope. Scale bar, 25 µm. (F) The frequency of sphere formation from single cells was equivalent at different passages (P5, P10, P15, and P20; n=3). (G) The proliferation rates of the isolated CM-SLCs at different passages (P5, P10, P15, and P20) were similar (n=3). (H) The average population-doubling times of cells at different passages (P5, P10, P15, and P20) were similar (n=3). (I) Testosterone production progressively increased during culture of CD271+ cells in differentiation-inducing medium (DIM; n=3). (J) At 14 days after differentiation, immunofluorescence staining showed that the differentiated cells clearly expressed the LCs lineage-specific markers LHR, StAR, SF-1, 3β-HSD, CYP11A1 and 17β-HSD. Scale bar, 50 µm. (K) RT-PCR analysis confirmed that the expression of the LCs lineage-specific markers was higher in differentiated cells (DIFF) compared to undifferentiated controls (UNDIFF), in which the markers were undetectable. Data are expressed as the mean ± sem and were analyzed by one-way ANOVA.

