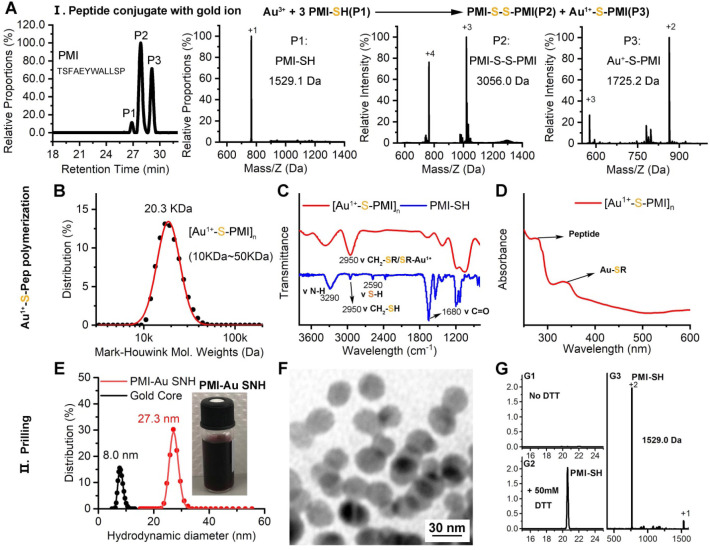
Figure 2.
Preparation and Characterization of PMI-Au SNH. (A) The High-Performance Liquid Chromatography (HPLC) analysis and ESI-MASS results of the three peaks, suggesting that Au+-S-peptide complex was successfully synthesized. (B) Molecular weight distribution of the [Au+-S-PMI]n polymers measured by the Mark-Houwink-Sakurada method, which uses empirical constants to calculate the molecular weight from the diffusion coefficient determined from the autocorrelation function of the scattered light (DLS). (C) FT-IR spectra of [Au+-S-PMI]n and PMI-SH. The characteristic peak of free thiol at 2590 cm-1 in PMI-SH disappeared, and a new peak at 2950 cm-1 appeared in the spectroscopy of [Au+-S-PMI]n. These results demonstrated the chemical bonds of S-Au were formed. (D) UV-Vis absorption spectra of [Au+-S-PMI]n. The distinct absorption peaks at 330 nm in the UV-Vis region is the absorption peaks for the Au-S-peptide species. (E) Hydrodynamic diameter distributions of PMI-Au SNH and Gold Core, and the solution photo of PMI-Au SNH. (F) transmission electron micrograph images (TEM) of PMI-Au SNH. (G) HPLC analysis of the residual PMI-SH in the liquid supernatant after the PMI-Au SNH synthesis and centrifugation (G1). G2 is the HPLC analysis of PMI-Au SNH-redissolved solution including 50 mM dithiothreitol (DTT), and G3 is the ESI-MASS result of the peak in G2.

