Figure 6.
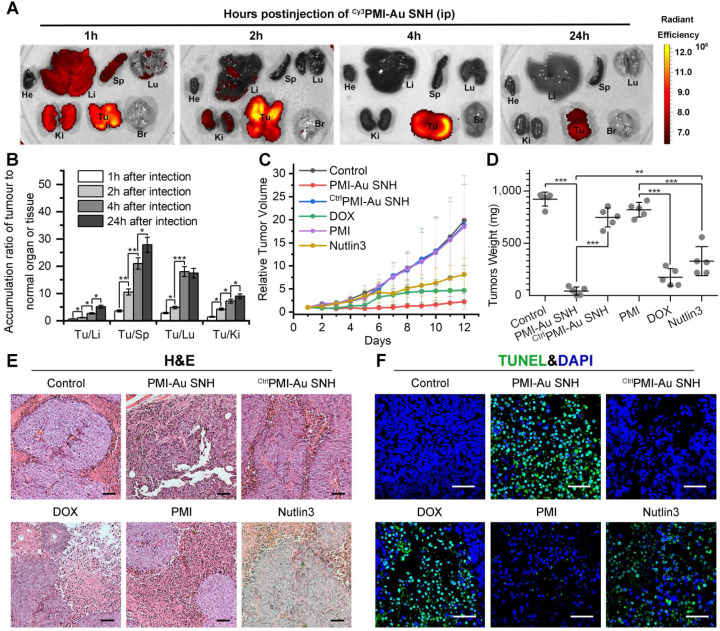
In vivo biodistribution and antitumor activity of PMI-Au SNH. (A) Tissue distribution and safety of PMI-Au SNH. The fluorescence signal from the tumors and normal organ after PMI-Au SNH intraperitoneal injection (200 µL, 1mM Au) at 1, 2, 4 and 24 h. (B) Tumor-to-normal tissue ratios for PMI-Au SNH after intraperitoneal injection (200uL, 1mM Au) at 1, 2, 4 and 24 h. (n =3/group, mean ± s.d.). p values were calculated by t-test (*, p<0.05; **, p < 0.01; ***, p < 0.001). (C) Tumor growth curves in nude mice subcutaneously inoculated with 1×10⁶ HCT116 cells into the right flank. A statistical analysis was performed using a non-parametric Kruskal-Wallis test. Data are presented as mean ± s.e. (n =5). (D) Weights of the tumors excised at the end of the experiment. (E) H&E staining (×200) of HCT116 solid tumor tissues after 12-day treatments. (F) representative images of Tunel staining for tumor tissue taken by confocal laser scanning micrscope (CLSM) (scale bar: 60 µm).

