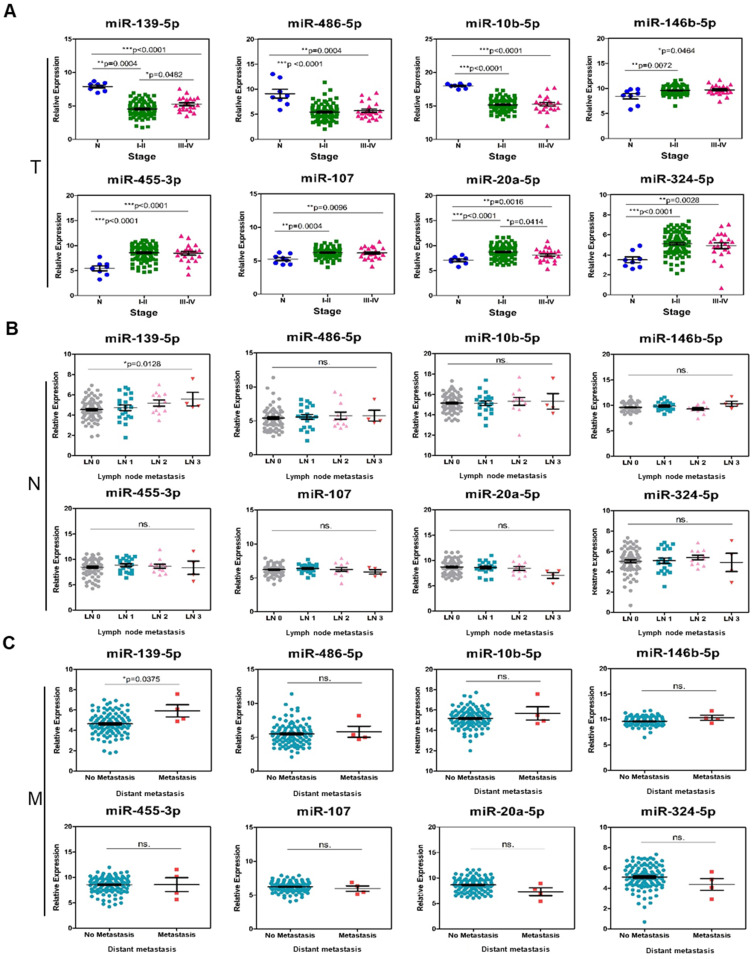
Figure 8.
The difference in 8-signature miRNA expression in subgroups divided by TNM classification. (A) 111 TNBC patients with 8 N vs. 89 stage I-II vs. 22 stage III-IV. The p-values were calculated with the Kruskal-Wallis test. (B) 111 TNBC patients with 74 LN0 vs. 21 LN1 vs. 12 LN2 vs. 4 LN3. The p-values were calculated with the Kruskal-Wallis test. (C) 111 TNBC patients with 107 no metastasis vs. 4 metastasis. The p-values were calculated using Student's t-test. *p<0.05; **p<0.01;***p<0.0001; ns is not significant. N: adjacent normal; T: tumor stage; LN: lymph node; M: metastasis.

