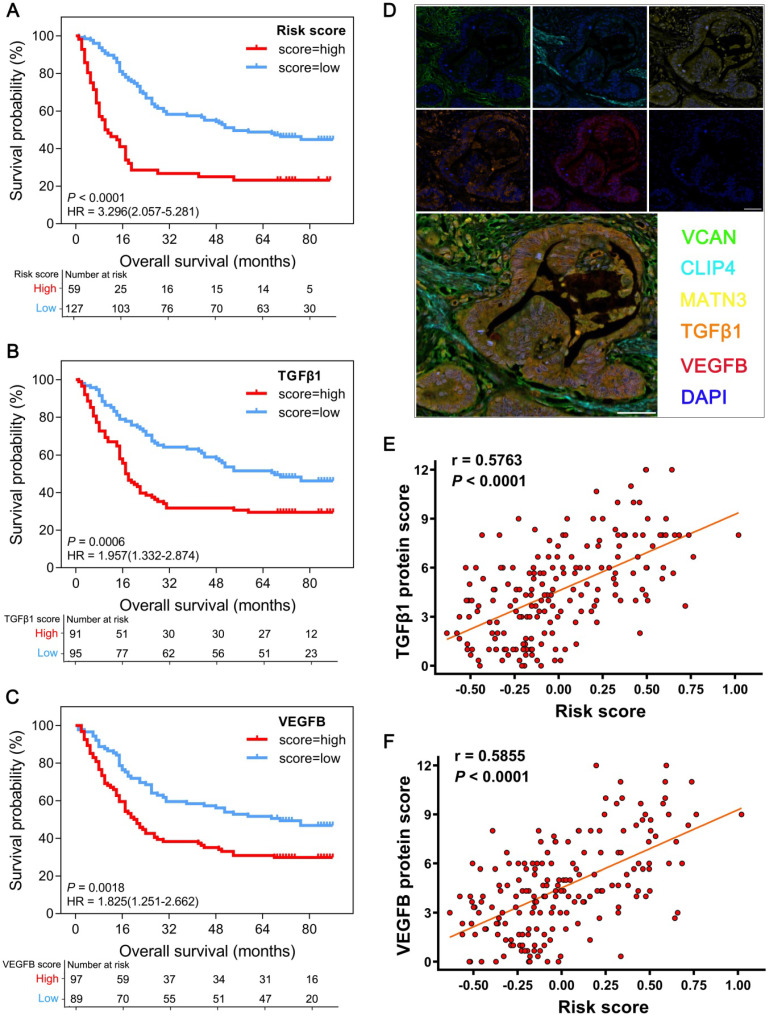
Figure 6.
Multiplex fluorescent immunohistochemistry (mfIHC) analysis of the relationship between GPSGC risk score, therapeutic target expression and overall survival with GC tissue microarray data. (A) Kaplan-Meier curves for high (n = 59) and low (n = 127) GPSGC risk score patient groups in GC tissue microarray data. Log-rank test, P < 0.0001. (B) Kaplan-Meier curves for high (n = 91) and low (n = 95) TGFβ1 expression patient groups in GC tissue microarray data. Log-rank test, P = 0.0006. (C) Kaplan-Meier curves for high (n = 97) and low (n = 89) VEGFB expression patient groups in GC tissue microarray data. Log-rank test, P = 0.0018. (D) mfIHC showed the protein expression and localization of VCAN (green), CLIP4 (cyan), and MATN3 (yellow) and the therapeutic targets TGFβ1 (orange) and VEGFB (red) in GC tissue. DAPI: blue; scale bar: 50 µm. (E) Scatter plots depicting the positive correlation between GPSGC risk score and TGFβ1 expression in GC tissue microarray data. Pearson's correlation coefficient is shown in the graphs (n = 186, P < 0.0001). (F) Scatter plots depicting the positive correlation between GPSGC risk score and VEGFB expression in GC tissue microarray data. Pearson's correlation coefficient is shown in the graphs (n = 186, P < 0.0001).

