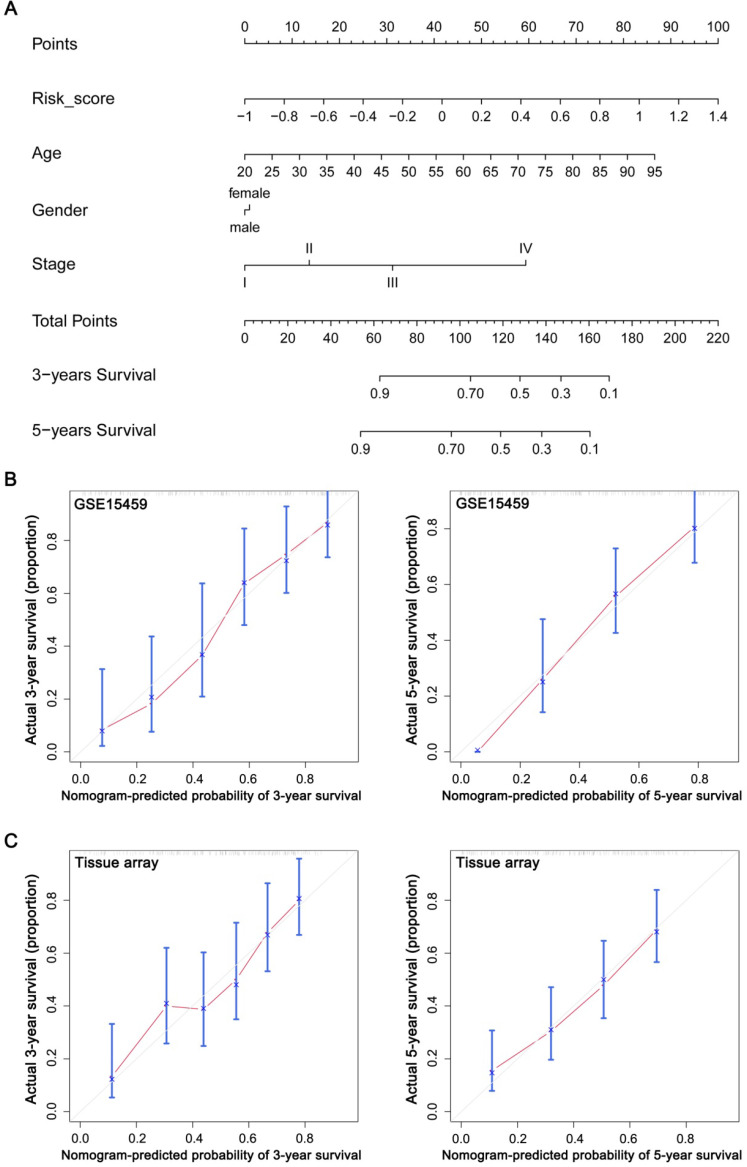
Figure 8.
Construction and evaluation of a nomogram based on the GPSGC to predict the 3-year and 5-year overall survival for GC patients. (A) Nomogram was constructed with the TCGA-STAD and ACRG training cohorts (n = 642) for predicting the probability of 3-year and 5-year OS for GC patients. (B) Calibration plot of the nomogram for predicting the probability of OS at 3, and 5 years in GSE15459 validation cohort (n = 192). (C) Calibration plot of the nomogram for predicting the probability of OS at 3, and 5 years in the experimental tissue array validation cohort (n = 186). The grey line represents the ideal nomogram, and the red line represents the observed nomogram.

