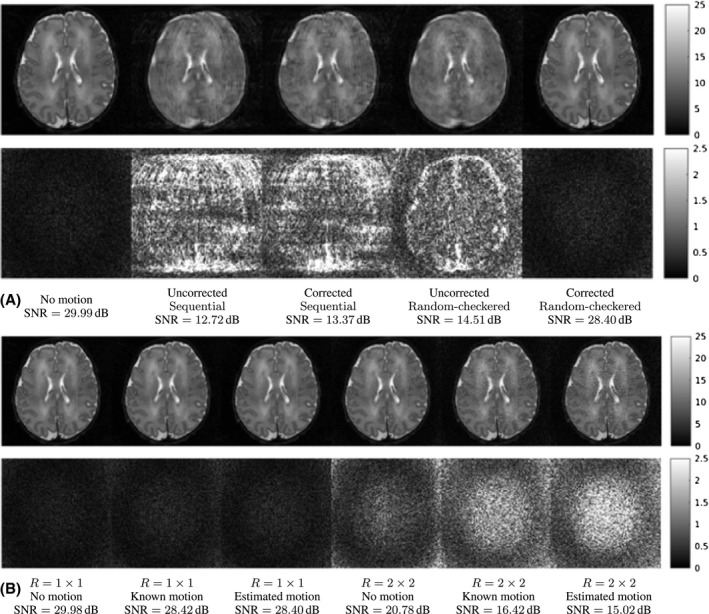
Figure 6.

Reconstruction results (A) without and with motion correction for Sequential and Random‐checkered traversals compared to the GT (top row) and corresponding error maps (bottom row) for M = 64/ and (B) for a Random‐checkered traversal without motion, and with known and estimated motion for R = 1 × 1 and R = 2 × 2 (top row) and corresponding error maps (bottom row)
