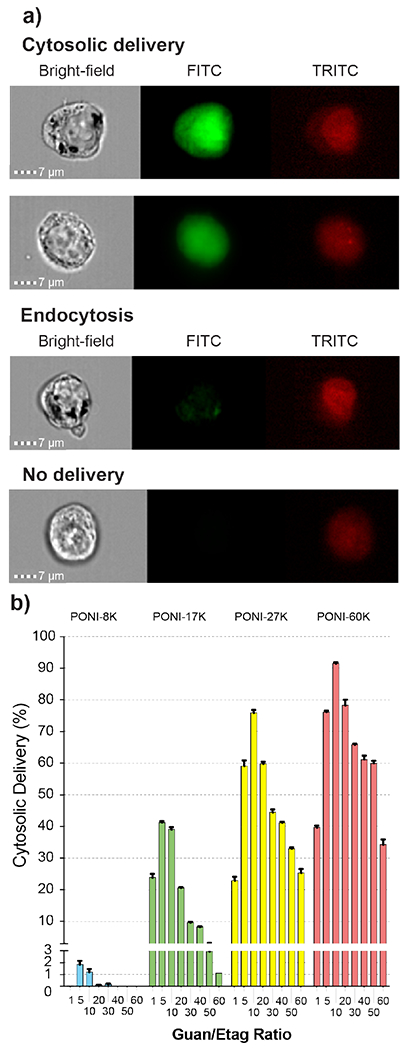
Figure 5.

(a) Representative imaging flow cytometry images of cytosolic delivery, endocytosis, and undelivered cells (n=5). Channels displayed are bright-field, 488 nm (FITC, for GFP), and 633 nm (TRITC, for DRAQ5 nuclear stain). All images at 60x magnification. Scale bar = 7μm. (b) Percentages of total cell populations with cytosolic delivery of GFP, as determined by flow imaging cytometry. Note the larger range of effective conditions for polymers with higher molecular weight.
