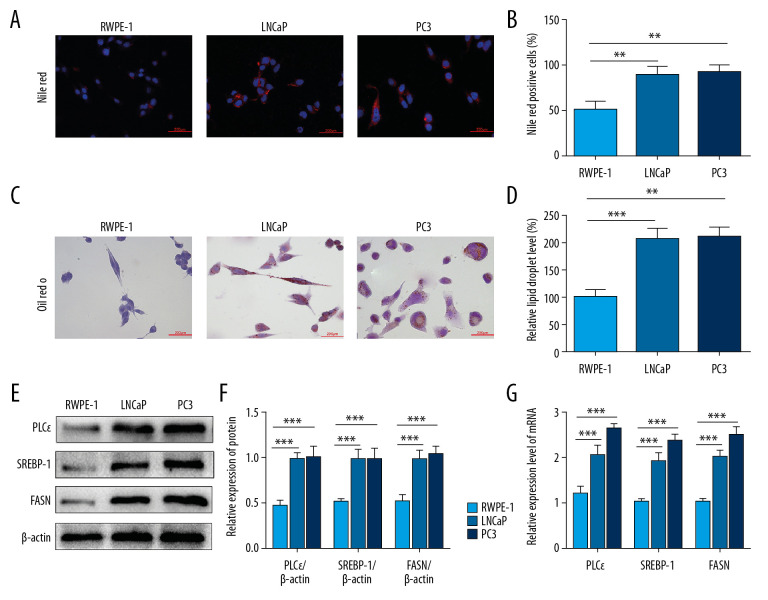
Figure 2.
PLCɛ and lipid metabolism are increased in PCa cells. (A–D) Lipid droplets content level of the PCa cells (LNCaP, PC3) and RWPE-1 cells were analyzed by Nile red staining and Oil red O staining (400×, 200 μm bar). (E–G) Western blot and qPCR were performed to test the protein and mRNA expression levels of SREBP-1, FASN, and PLCɛ. The intensity of protein was quantified by image J software. Data are shown as mean±SD. *** p<0.001, ** p<0.01.

