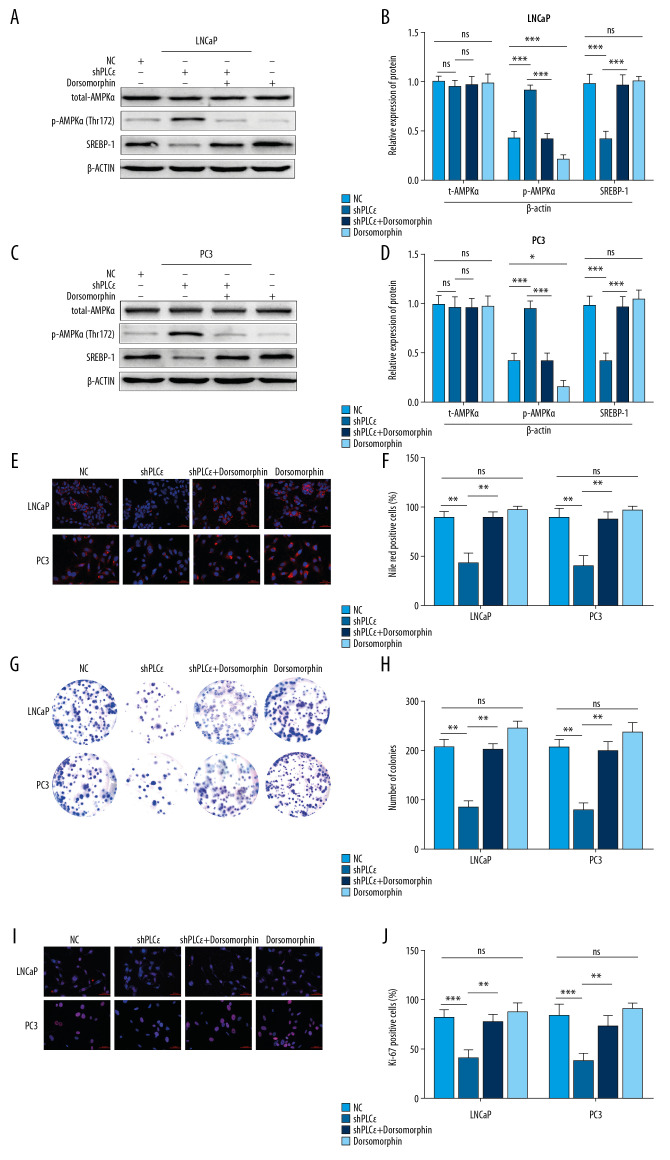
Figure 6.
Silencing PLCɛ suppresses proliferation and lipid metabolism through AMPK/SREBP-1. (A–D) The protein levels of total-AMPKα, p-AMPKα, and SREBP-1 of PCa cells with different treatments, as determined by Western blot. (E, F) Nile red staining assay was used to assess lipid droplets content of PCa cells with different treatments. (G–J) Fluorescence of Ki-67 and colony formation assay were used to examine proliferation of PCa cells with different treatments. *** p<0.001, ** p<0.01, * p<0.05, ns – no statistical significance; NC – negative control. (400×, 200 μm bar).

