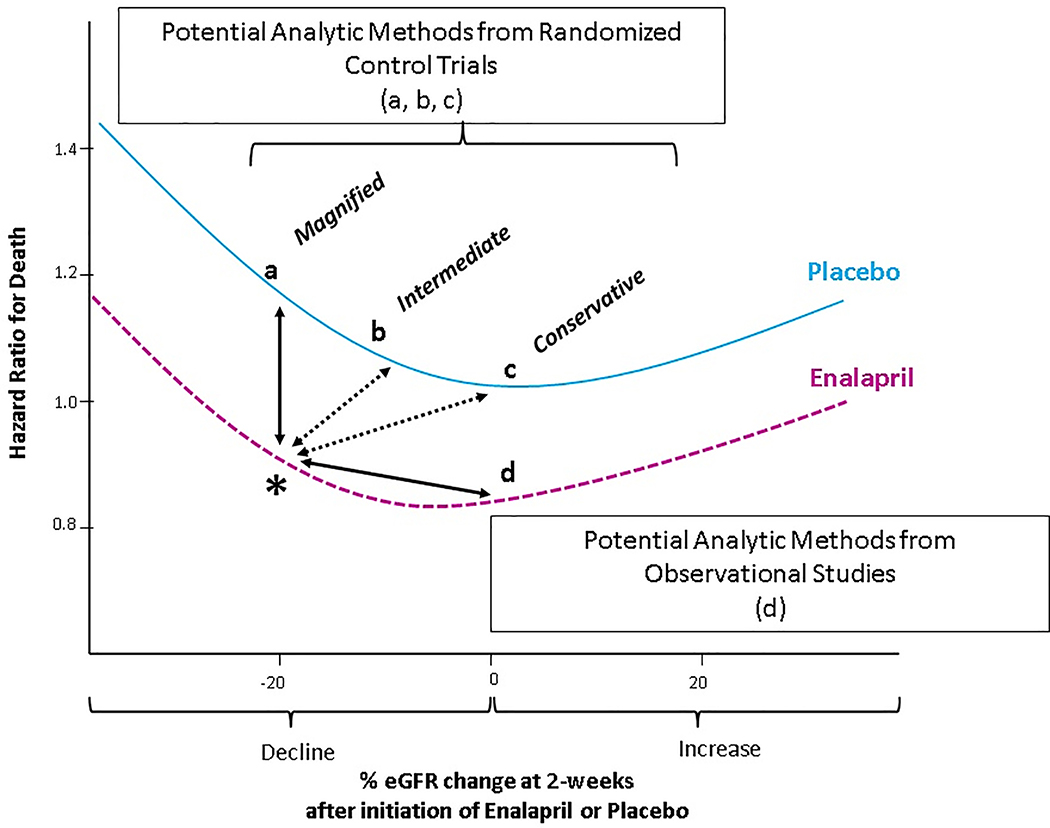
Figure 1. Representation of the potential different reference groups (a, b, c, d) for ascertainment of the hazard ratio for death for a 20% decline in eGFR (*).
Hazard ratio curves for varying changes in eGFR at 2-weeks after randomization to placebo and treatment were estimated by using restricted cubic spline modeling. The hazard ratio for death for a decline of 20% in eGFR at 2-weeks after randomization to enalapril (represented by the asterisk) could differ depending on the reference group,, with options a,b,c as potential reference groups drawn from randomized studies and option d as potentially drawn from observational studies. Option (a) as employed in much of the prior literature,15,20 would be a placebo patient with 20% eGFR decline, under the assumption that none of the decline on enalapril was due to hemodynamic decline; option (b) would be a placebo patient with 10% eGFR decline under the assumption that half of the decline on enalapril was due to hemodynamic effect; option (c) would be a placebo patient with 0% eGFR decline under the assumption that all of the decline on enalapril was due to hemodynamic effect. Option (d) would be an enalapril patient with 0% eGFR decline, as done in prior observational studies.19 HR indicates hazard ratio; eGFR indicates estimated glomerular filtration rate.

