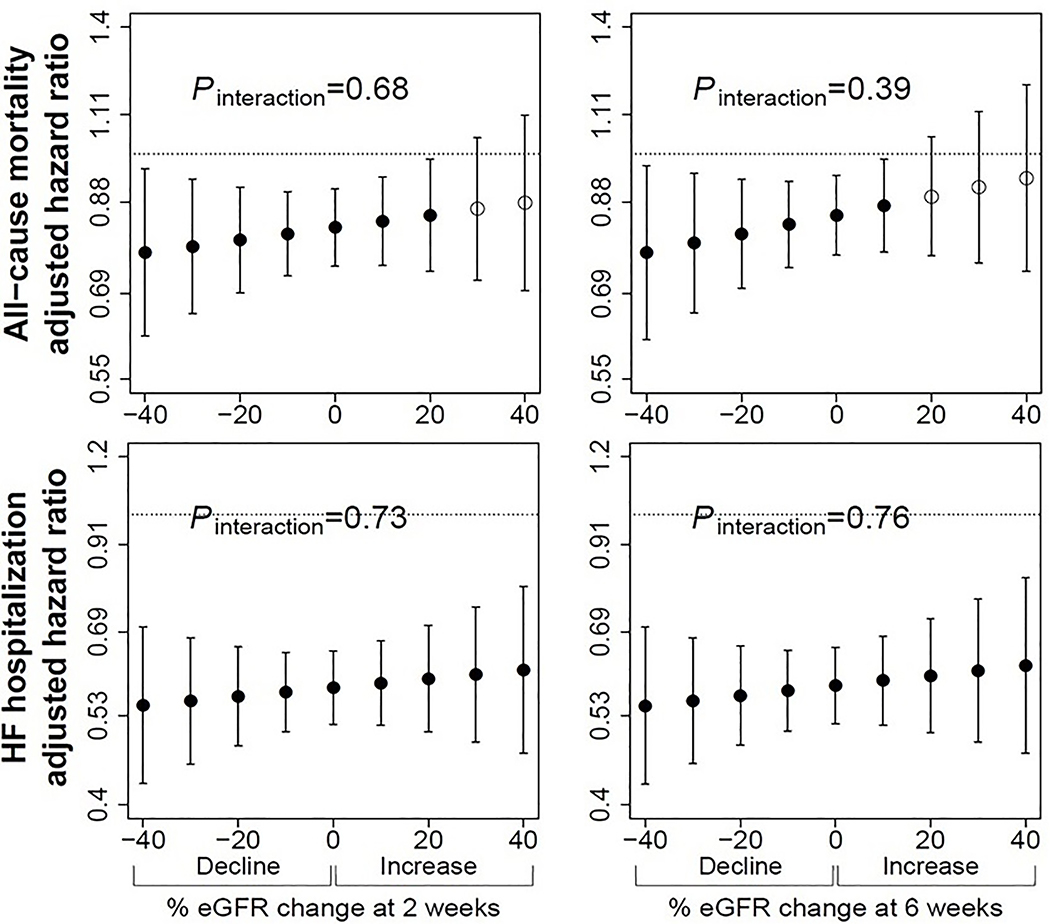
Figure 2. Multivariable adjusted hazard ratios for all-cause mortality and heart failure hospitalization for those randomized to enalapril versus placebo according to magnitude of decline at 2-weeks (left), and 6-weeks (right).
Filled circles represent points at which there was a significant hazard ratio for enalapril group versus placebo. There was no significant interaction between decline and treatment at any time point. eGFR indicates estimated glomerular filtration rate, calculated using adjusted serum creatinine and CKD-EPI equation. Pinteraction indicates p-value for interaction. Number of patients at each follow-up time point were 6245 at 2-weeks, and 6055 at 6-weeks. Models adjusted for age, sex, race, baseline kidney function, previous myocardial infarction, smoking, NYHA functional class, diastolic blood pressure, hematocrit, potassium, and trial.

