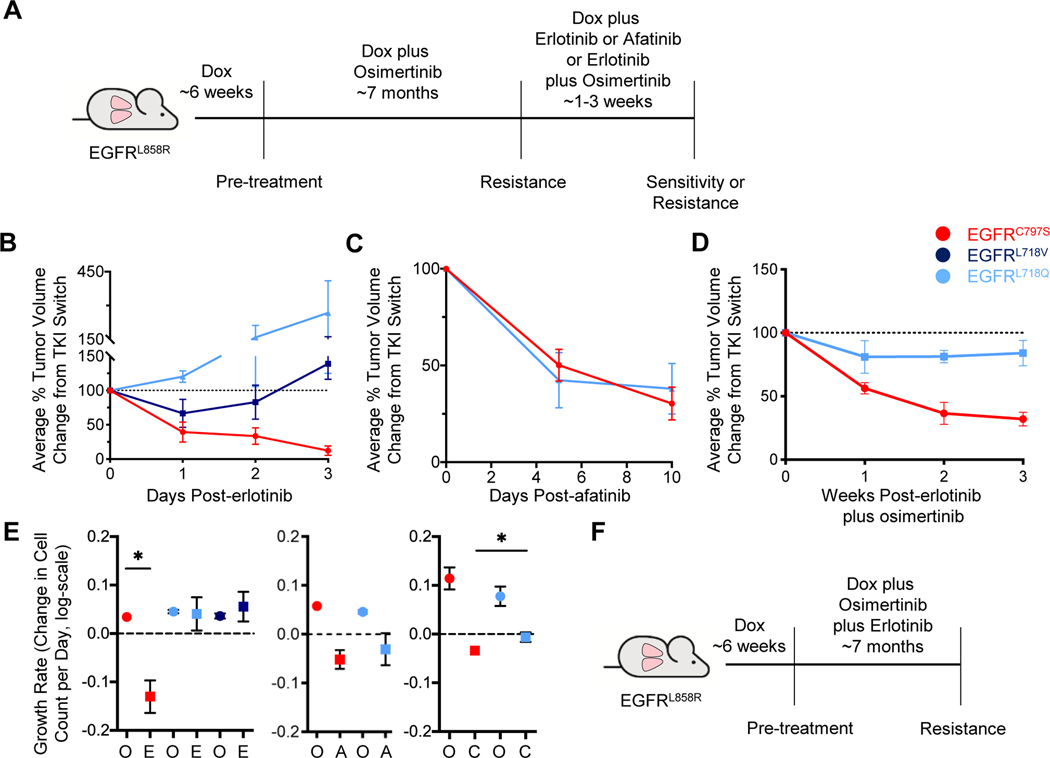
Figure 5. The sensitivity of osimertinib-resistant tumors to erlotinib or afatinib treatment depends on the specific osimertinib resistance mutation present.

A. Schema of the experiment. CCSP-rtTA;TetO-EGFRL858R mice were treated with 25 mg/kg osimertinib until the emergence of resistant tumors, as in Figure 1. Mice were then switched to either erlotinib, afatinib, or the combination of erlotinib plus osimertinib for 1–3 weeks. B, C, and D. Average tumor volume changes for the osimertinib-resistant tumors switched to 25 mg/kg erlotinib for 3 weeks (B), 25 mg/kg afatinib for 10 days (C), and erlotinib plus osimertinib (D, 25 mg/kg each) as determined by MRI. Tumor volume is normalized to the point of TKI switch. Error bars represent SEM. For B, curves are the average of n=11 total tumors (C797S n=5; L718V n=3; L718Q n=3). For C, n=12 total tumors (C797S n=7; L718Q n=5). For D, n=10 total tumors (C797S n=7; L718Q n=3). E. Graphs of tumor growth rates for the osimertinib-resistant tumors before and after they were switched to erlotinib (left), afatinib (center), or erlotinib plus osimertinib (right). Growth rates are depicted as the relative change in cell count per day (log-scale). F. Schema of the experiment. TKI-naïve CCSP-rtTA;TetO-EGFRL858R mice were treated with the combination of osimertinib plus erlotinib (25 mg/kg each) until the emergence of resistant tumors. Error bars represent SEM. (* indicates p<0.05). O, osimertinib; E, erlotinib; A, afatinib; C, erlotinib plus osimertinib.
