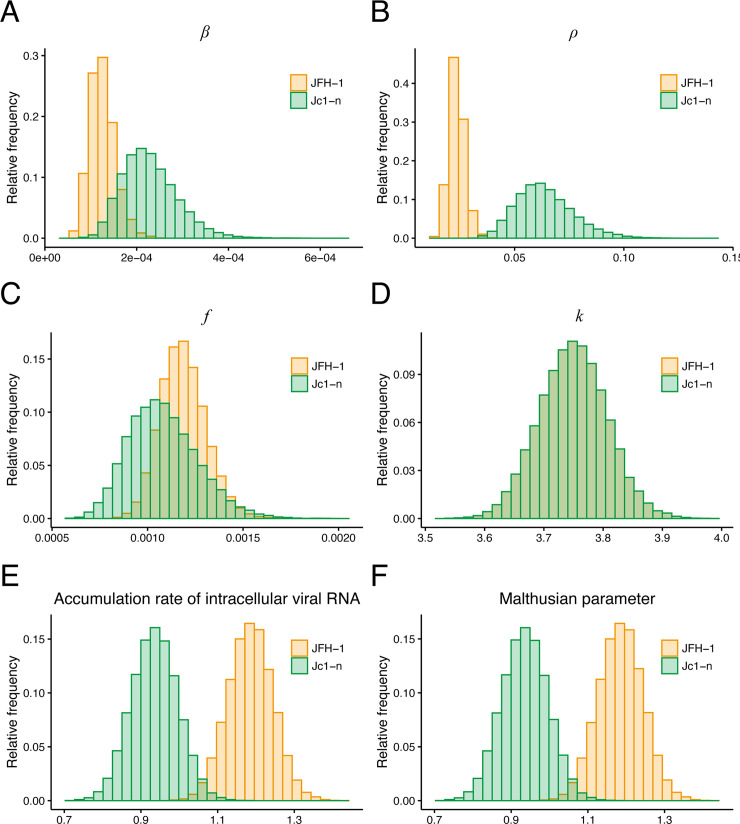
Fig 3. Characterization of viral dynamics of HCV JFH-1 and Jc1-n.
The distributions of the rate constant for infection, βθ; the release rate of intracellular viral RNA, ρ; the converted fraction of infectious viral RNA, fθ; and the replication rate of intracellular viral RNA, k, inferred by MCMC computations are shown in (A), (B), (C) and (D), respectively, for HCV JFH-1 (orange) and Jc1-n (green). Parameters βθ and ρ for Jc1-n were significantly larger than for JFH-1, whereas there was no significant difference in fθ between the two strains as assessed by repeated bootstrap t test. JFH-1 and Jc1-n stains had identical viral RNA replication rates. The distributions of accumulation rates of intracellular viral RNA, k−μ−ρ, and the Malthusian parameter, M, calculated from all accepted MCMC parameter estimates are shown in (E) and (F), respectively, for HCV JFH-1 (orange) and Jc1-n (green). These indices were significantly larger for JFH-1 than for Jc1-n as assessed by the repeated bootstrap t test. The underlying data for this Figure can be found in S2 Data. HCV, hepatitis C virus; MCMC, Markov chain Monte Carlo.

