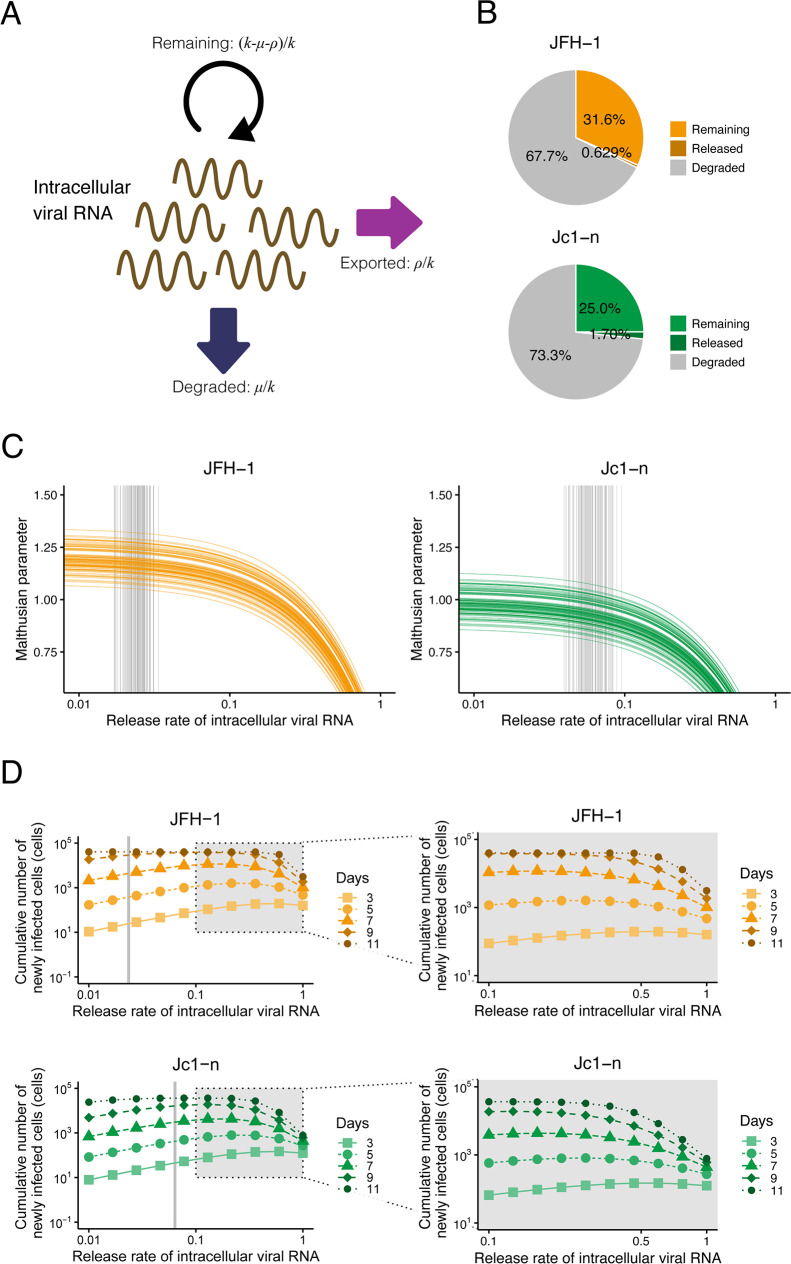
Fig 4. Different strategies adopted by JFH-1 and Jc1-n for viral proliferation.
(A) Schematic representation of the fate of replicated intracellular viral RNA. Viral RNA is used either for driving RNA replication in cells or for producing progeny viruses for release outside cells or is degraded. (B) Percentage of replicated intracellular HCV JFH-1 and Jc1-n viral RNA that remains inside cells, is released outside cells, and is degraded. (C) Change in the Malthusian parameter (Eq 7) with various release rates of intracellular viral RNA. The orange and green curves show Malthusian parameters calculated using 100 parameter sets sampled from MCMC parameter estimates as functions of ρ for JFH-1 and Jc1-n, respectively. The gray vertical lines are the corresponding release rates estimated from the actual experimental data. (D) Change in the cumulative number of newly infected cells with the various release rates (Eq 8). (Left panels) The orange and green curves represent the cumulative numbers of newly infected cells until 3, 5, 7, 9, and 11 days post infection calculated using the means of estimated parameters as a function of ρ for JFH-1 and Jc1-n, respectively. The gray vertical line represents the mean release rate estimated from the experimental data. (Right panels) Enlarged views of the gray zones in left panels. Finely calculated cumulative numbers of newly infected cells are shown. The underlying data for this figure can be found in S3 Data. HCV, hepatitis C virus; MCMC, Markov chain Monte Carlo.

