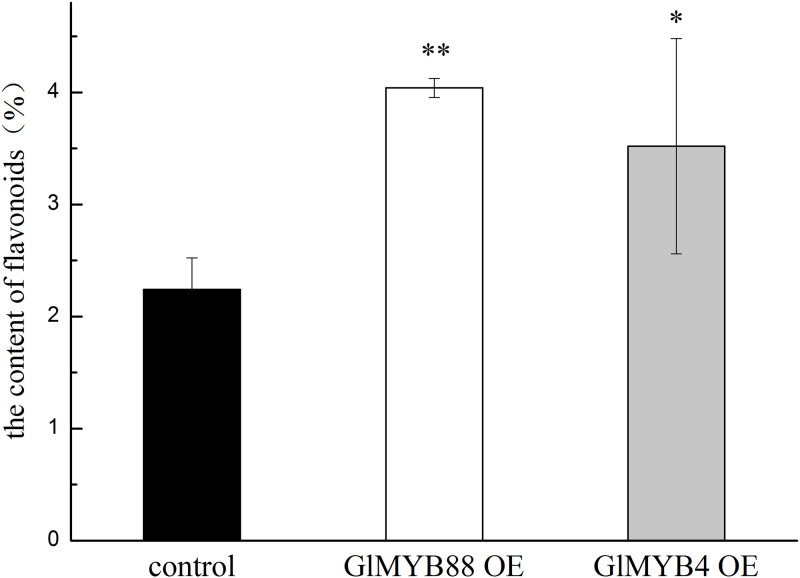
Fig 8. Determination of the total flavonoids in the control and experimental groups.
Data presented here are the mean of three replicates with error bars indicating ± SD. Asterisks indicate significant differences with values for the empty vector control: *P < 0.05; **P < 0.01. Control: untransformed cell; GlMYB4 OE: overexpression GlMYB4 group; GlMYB88 OE: overexpression GlMYB88 group.

