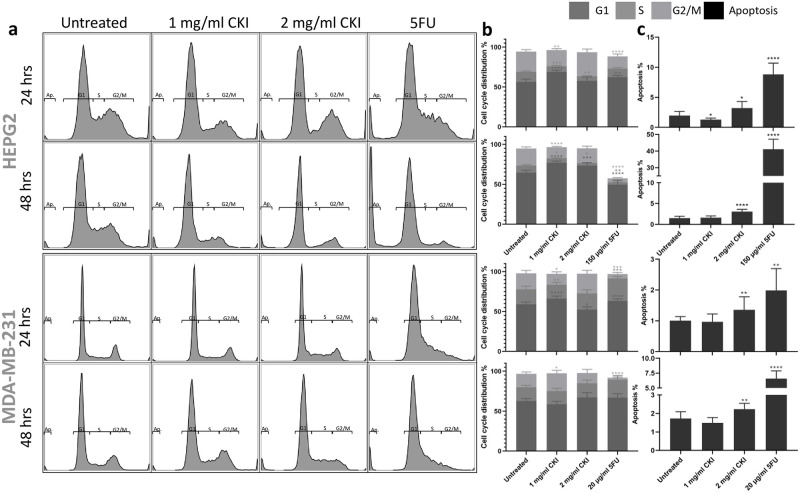
Fig 1. Effects of different treatment on cell cycle and apoptosis of Hep G2 and MDA-MB-231 cells.
a: The apoptosis and cell cycle distribution of each cell line after 24- and 48-hour treatments with CKI or 5-Fu assessed by PI staining. b: Percentages of cells in different phases of cell cycle resulting from treatment. c: Percentage of apoptotic cells after treatment. Results shown are mean ±95%CI (from 6 triplicates, see Methods). Statistically significant differences from untreated control were identified using two-way ANOVA (*p<0.05, **p<0.01, ****p<0.0001).

