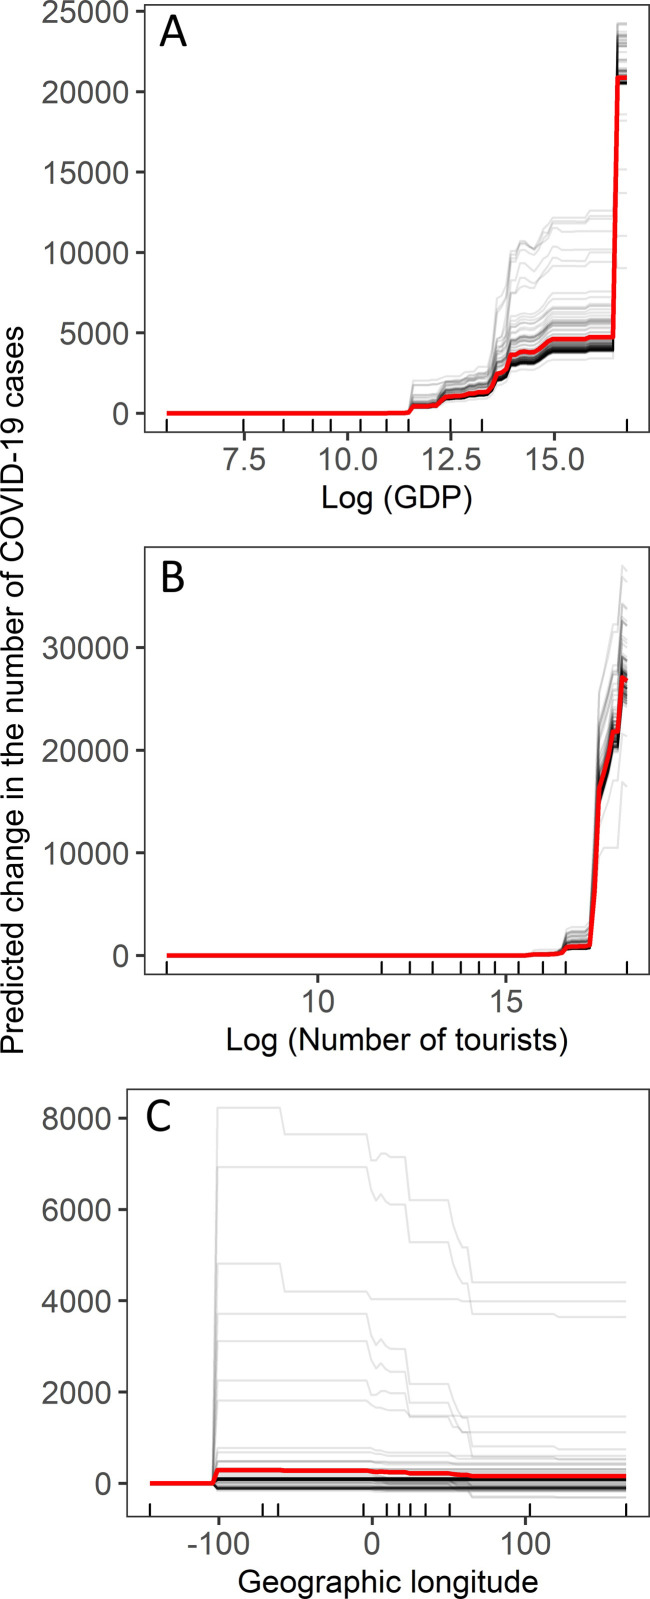
Fig 3.
Centred individual conditional expectation plots of the predicted number of COVID-19 cases by a) number of tourists, b) gross domestic product, and c) geographic longitude. The lines show the difference in prediction compared with the prediction with the respective value of the explanatory variables at their observed minimum. The red line is the averaged marginal functional estimate from the gradient boosting regression trees. Rug plots inside the bottom of the plots show the distribution of data, in deciles, of the variable on the X-axis.

