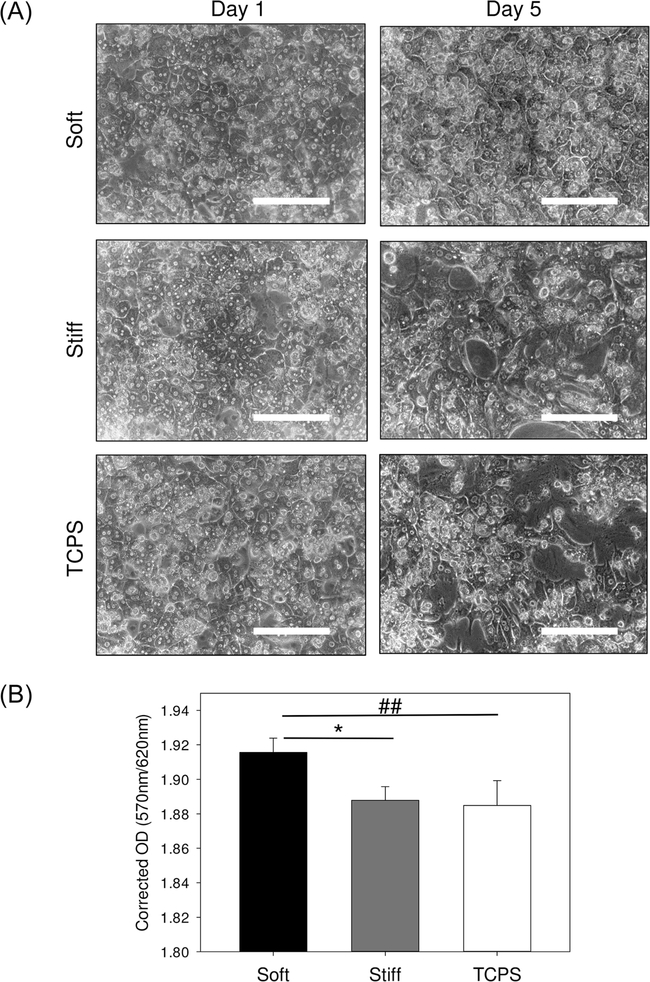
Fig. 1.
(A) Characterization of primary hepatocyte morphology when cultured on soft, stiff and TCPS substrates; (B) quantification of primary hepatocyte viability using MTT assay on day 5 in culture, scale bar = 200 microns, significant difference between the soft/stiff group and TCPS group is denoted by ##p value < 0.005, significant difference between the soft and stiff group is denoted by *p value < 0.05.

