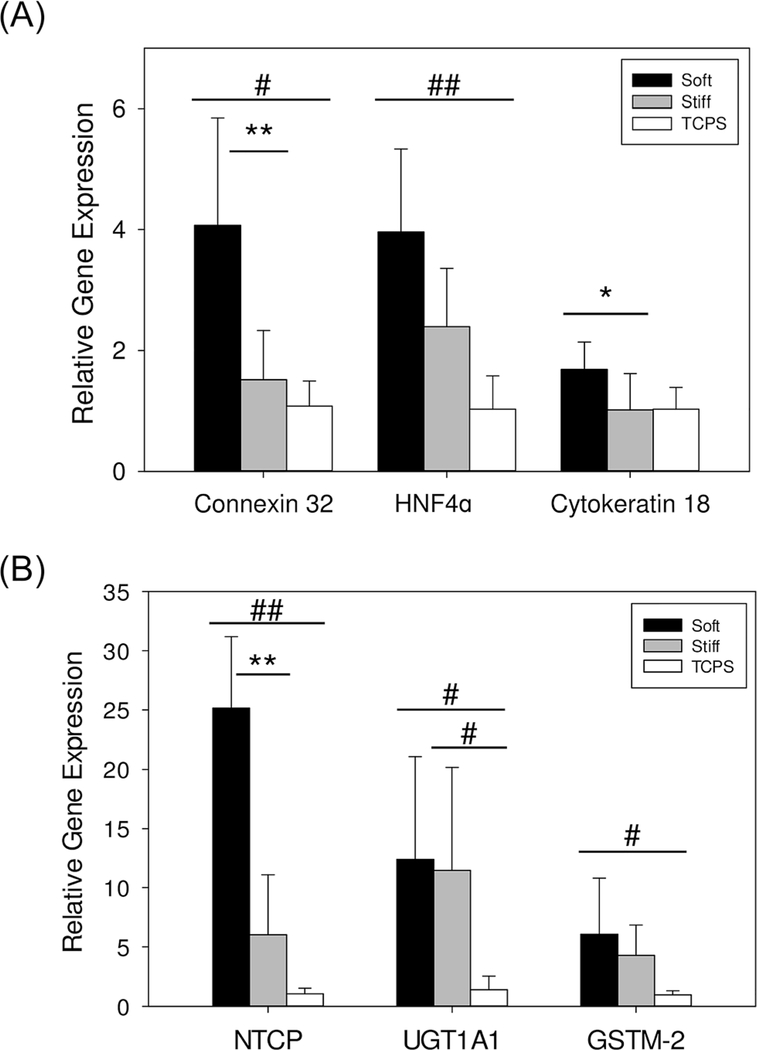
Fig. 5.
(A) Gene expression analysis of epithelial cell markers of primary hepatocytes cultured on soft, stiff and TCPS substrates on day 7; (B) gene expression analysis of hepatic functional markers on day 7, significant difference between the soft/stiff group and TCPS group is denoted by #p value < 0.05, ##p value < 0.005, significant difference between the soft and stiff group is denoted by *p value < 0.05 and **p value < 0.005.

