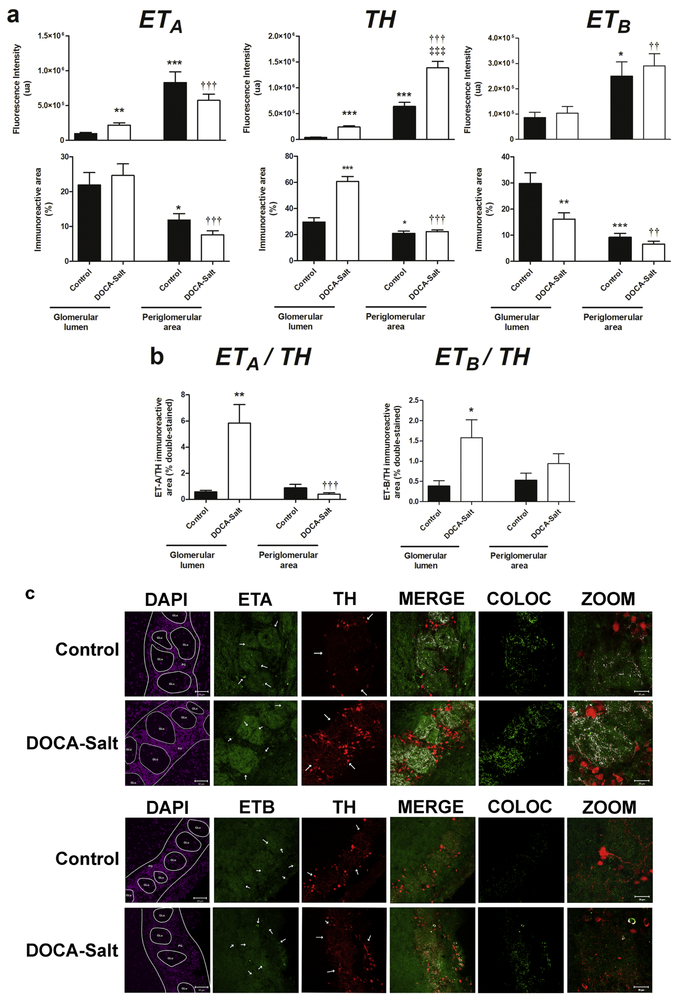
Figure 2: Expression, distribution and co-localization of endothelin receptors (ETA and ETB) and tyrosine hydroxylase (TH) in the glomerular layer of the olfactory bulb of normotensive and DOCA-Salt hypertensive rats.
Endothelin receptors and TH were assessed in the glomerular lumen and the periglomerular area of the olfactory bulb by confocal microscopy as detailed in Materials and Methods. Incubations were performed with a triple staining: ETA/TH/DAPI or ETB/TH/DAPI. DAPI images were used to determine the glomeruli lumen and to discriminate the glomerular layer from other olfactory bulb layers. (a) Quantifications corresponding to total fluorescence intensity and percentage of immunopositive areas for ETA, TH and ETB. The quantification was performed with the Image J software in the stack of the images set, always limiting the measurement to the threshold value of each set of images. (b) Quantification of the co-localization of ETA/TH or ETB/TH expressed as percentage of the double-immunopositive area. Using an Image J plugin for co-localization measurement and the threshold value for the images previously calculated two images were generated with colocalization information: one with the double staining and the co-localized pixels marked in white, and another one only with the co-localized pixels depicted. The later was quantified to evaluate the percentage of the double-immunopositive area (c) Representative images for DAPI, ETA (uppers rows), ETB (lower rows) and TH. Colocalization is shown in white (MERGE). COLOC: Colocalization 8-bit image from the colocalization analysis); ZOOM: images acquired with a 2.8X optic zoom to further discriminate the colocalization of ETA/TH or ETB/TH in the OB. Arrow heads show immunopositive fibers or cell bodies. *: p<0.05, **: p<0.01, ***: p<0.001 vs. Control (glomerular lumen); ††: p<0.01, †††: p<0.001 vs. DOCA-salt (glomerular lumen); ‡‡‡ p<0.001 vs. Control (periglomerular area). Number of animals per experimental group: 5

