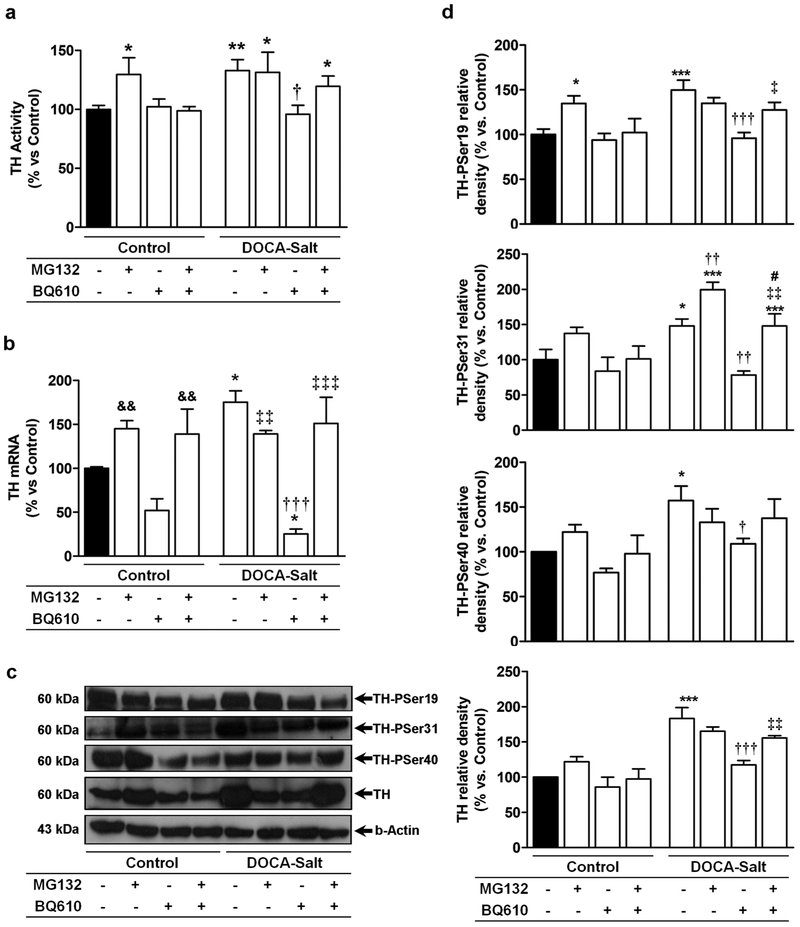
Figure 6: Tyrosine hydroxylase (TH) activity and expression in the olfactory bulb of normotensive and DOCA-salt hypertensive rats following proteasome inhibition and ETA blockade.
(a) TH activity, (b) TH mRNA, (c) representative western blots and (d) densitometric analysis of total TH and its phosphorylated forms assessed in the OB following MG132 (proteasome inhibitor) (20 μM) and/or BQ610 (selective ETA antagonist) (20 μM) administration as detailed in Materials and Methods. * p<0.05, ** p<0.01 and ***:p<0.001 vs Control; †: p<0.05, ††: p<0.01, and †††: p<0.001 vs. DOCA-Salt; ‡: p<0.05, ‡‡:p<0.01, and ‡‡‡: p<0.001 vs. DOCA-Salt+BQ610; &&: p<0.01 vs. BQ610; #: p<0.05 vs. DOCA-Salt+MG132. Number of animals per experimental group: 4-6.

