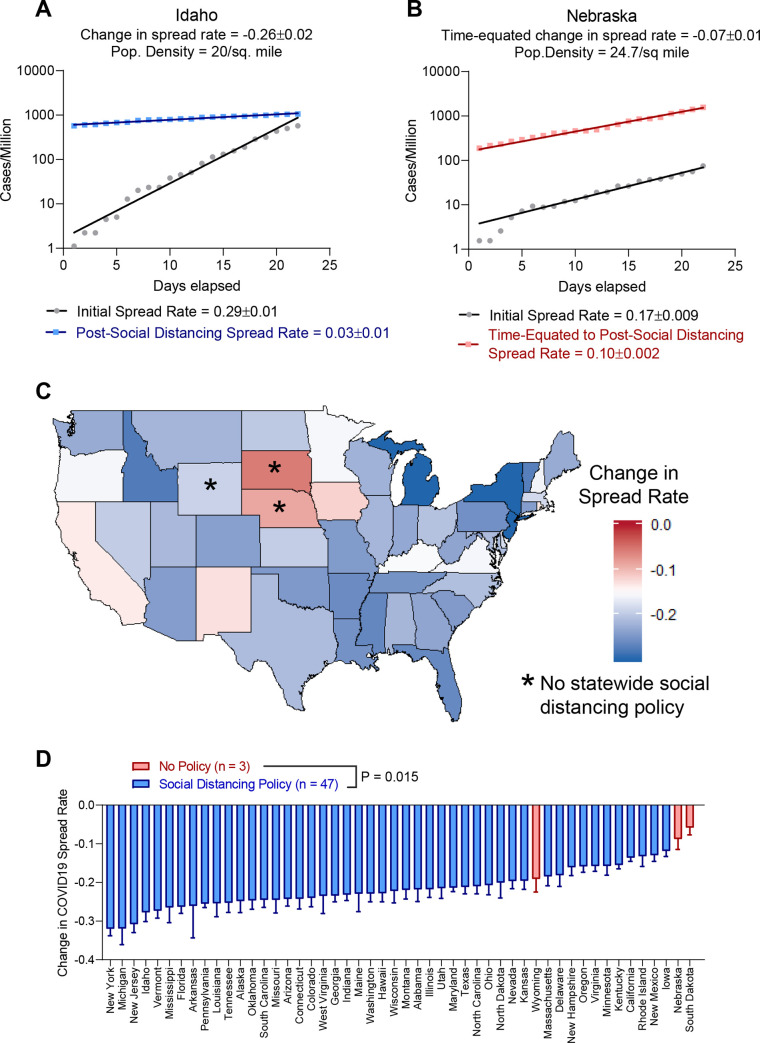
Fig 1. Social distancing policies corresponded with inhibited spread of COVID19 in the United States.
(A) Fitting of COVID19 initial spread rate and spread rate following social distancing implementation in Idaho. (B) Fitting of COVID19 initial spread rate and a second time interval matched to post-social distancing in Nebraska where no policy was implemented. (C) Heat map showing change in COVID19 spread rate after implementing statewide social distancing policy, or a time-matched interval in states without social distancing policies (Nebraska, Wyoming, and South Dakota). (D) Bar graph showing values in (C), with states that did not implement social distancing policies shown in red. Error bars indicate 95% confidence interval. Rank-sum test.

