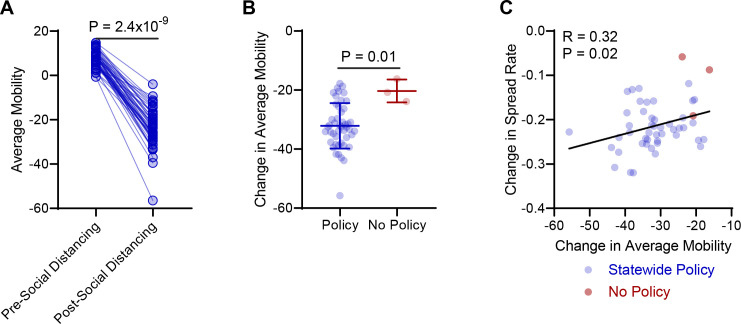
Fig 2. Social distancing policies correspond with reduced average mobility in the United States.
(A) Average mobility from Google mobility reports prior to implementation of social distancing and after implementation of social distancing in US states that enacted social distancing policies. Signed rank test. (B) Change in average mobility determined from Google mobility reports following implementation of social distancing policies (blue), or time-equated periods in states with no social distancing policies (red). Median with interquartile range. Rank-sum test. (C) Correlation of change in COVID19 spread rate and change in average mobility. Spearman correlation coefficient.

