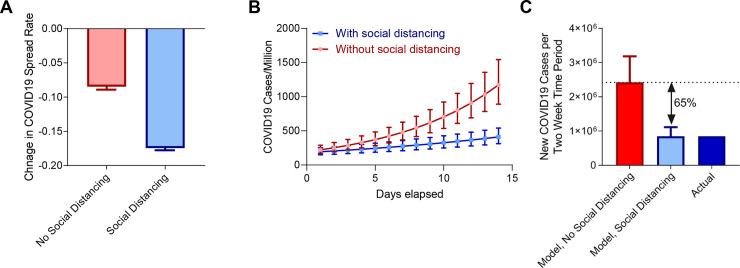
Fig 4. Prevention of new COVID19 cases by social distancing policies.
(A) Change in COVID19 spread rates following implementation of social distancing policies (blue), or time-equated periods in countries with no social distancing policies (red). Data were fit using a generalized linear mixed-effects model taking each country as a random effect. Bars represent change in regression coefficient ± standard error. (B) Modeling of new COVID19 cases per million inhabitants in countries with social distancing policies using either model fit directly to data following implementation of social distancing policies (blue), or after correcting for the observed reduction in COVID19 spread rates associated with social distancing policies (red). Points represent model COVID19 cases per million ± standard error. (C) Estimation of total new cases over a two-week period if countries had not implemented social distancing policies (red), with implementation of social distancing policies (light blue), and actual new cases (dark blue). Bars represent number of COVID19 cases in the countries with social distancing policies ± standard error.

