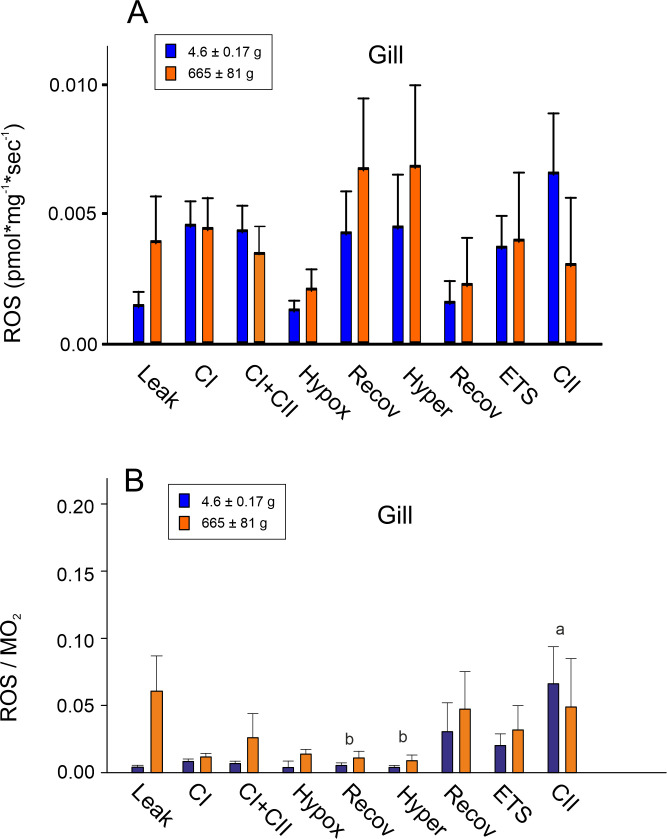
Fig 3.
(A) Mitochondrial ROS production of permeabilized gill cells of small and larger Arapaima gigas. Measurement conditions were as outlined in Fig 1; (N = 6; p<0.05). (B) Ratio of ROS production related to oxygen consumption (ROS/MO2) in small and larger A. gigas gill tissue. Measurement conditions were as outlined in Fig 1. Different small letters indicate differences among treatments; (N = 6; p<0.05).

