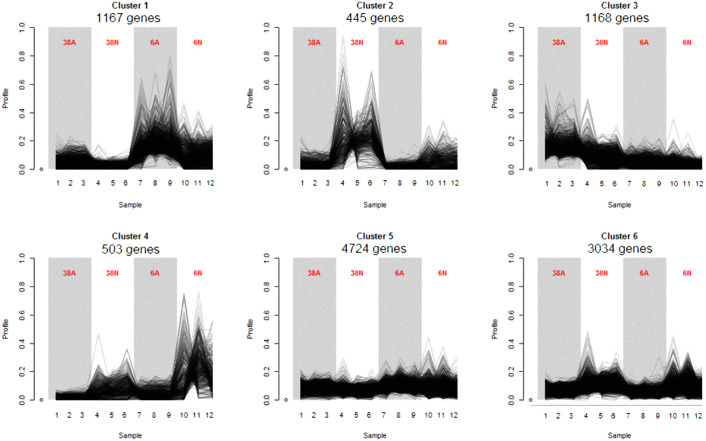
Fig 3. Co-expression clusters.
HTSCluster was used to cluster expression data with Poisson Mixture Models. The number of genes assigned to a particular cluster is indicated below the cluster name. Grey and white backgrounds are for acidic and neutral pH, respectively. Each of the 12 samples is depicted on the x-axis and each biological condition (three replicates) is on the top of the curves. Y-axis represents, for each gene, the number of counts divided by the total number of counts in all the samples (frequency). A: acidic pH and N: neutral pH.

