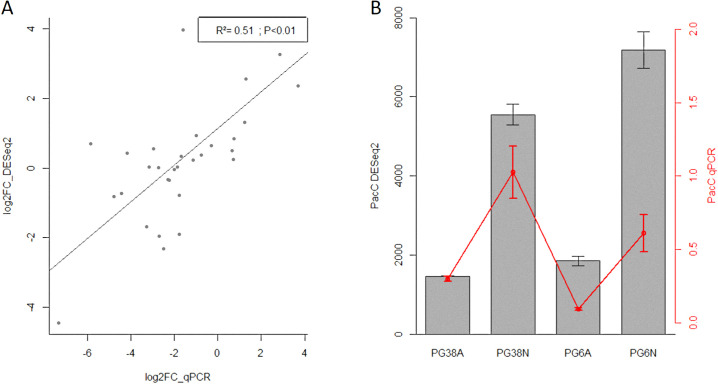
Fig 7. RT-qPCR and RNAseq data comparison.
A. Correlation between log2FoldChange of quantitative real-time PCR (x-axis) and RNAseq (y-axis) on 8 selected genes in the four main contrasts. B. Comparison of pacC mean expression in all samples (black bars represent RNAseq results; red points represent RT-qPCR results). Errors bars represent standard errors of the means. A: acidic pH; N: neutral pH; pacC DESeq2: transcript expression of pacC (DESeq2 normalized counts); pacC qPCR: transcript expression of pacC (RT-qPCR expression normalized with external controls).

