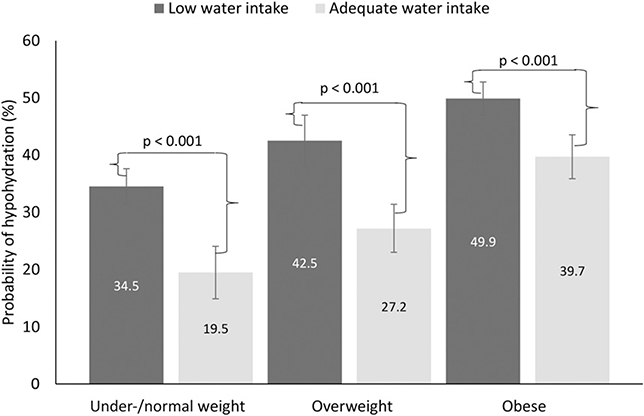
FIGURE 2.
Predicted probabilities (95% CIs) of hypohydration by water intake status and weight status in adults aged ≥20 y in the United States, 2009–2012. n = 9601. Data were generated with the use of marginal standardization from the log-binomial regression model that included an interaction between weight status and water intake status (F = 4.78, P = 0.015). BMI (in kg/m2) categories were as follows: underweight or normal weight, <25; overweight, 25 to <30; and obese, ≥30. Low water intake (dark gray bars) was defined as follows: men, <3.7 L; women, <2.7 L; and adequate water intake (light gray bars) was defined as follows: men, ≥3.7 L; women, ≥2.7 L. Data source: CDC/National Center for Health Statistics, NHANES (26).

