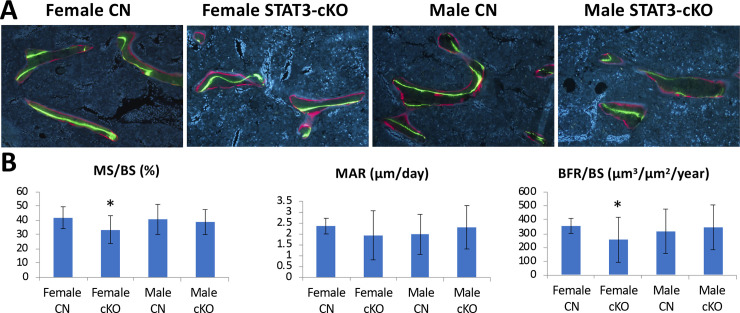
Fig 3. Dynamic histomorphometry analysis of femurs labeled with calcein and alizarin fluorescent dyes.
A) Representative figures of distal femurs from 8 weeks old female and male control (CN) and STAT3-cKO mice. B) Data include mineral surface/bone surface (MS/BS), mineral apposition rate (MAR), and bone formation rate/bone surface (BFR/BS). The region 0.5 mm proximal from the growth plate of each was analyzed (* p < 0.05 compared to sex-matched controls, n = 11-17/group).

