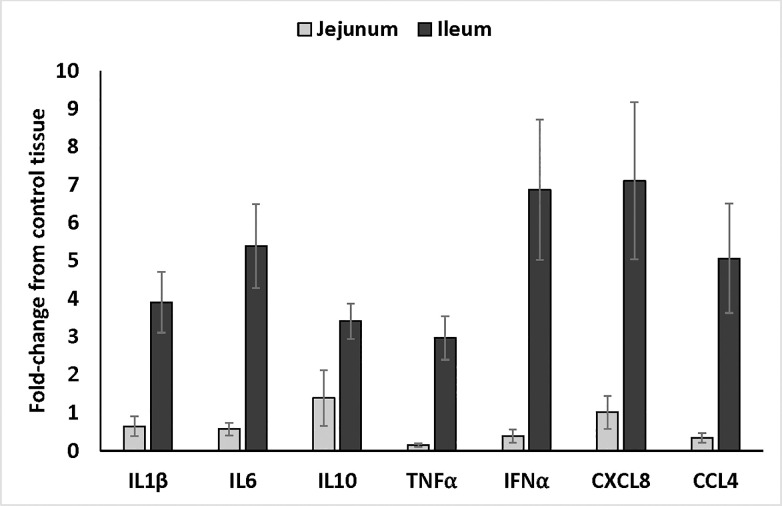
Fig 3. Cytokine and chemokine mRNA expression in ileum and jejunum samples from supplement-fed chickens compared to those on control diet.
Quantitative real-time RT-PCR was used to validate the array data. The mRNA expression levels of various cytokines and chemokines were measured in Ileal (n = 10 treatment [5 per experiment]) and jejunal (n = 10 treatment [5 per experiment]) samples from control and supplement-fed chickens. Sample standardization was done using 28S RNA. Results were calculated as 40-cycle threshold (CT) for each tissue sample from control- and supplement-fed chickens and the data are presented as the fold-change from controls. Fold change was calculated as 2^(supplement-fed corrected mean–control-fed corrected mean) for each tissue. Data are presented as the fold-change comparing the supplement-fed tissue samples to the corresponding control sample.

