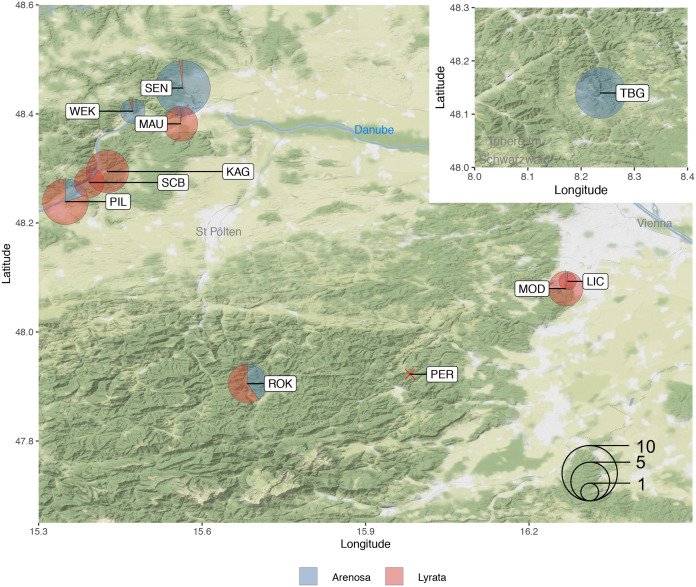
Fig 1. Map of maternal seed lines collection sites from the eastern Austrian fore Alps and Wachau valley.
Collection sites are indicated as circles for tetraploid plants and an X for diploids. Pie chart circle size represents the numbers of plants sampled and analysed from each site and the proportion indicates the relative amounts of admixture between A. lyrata (red) and A. arenosa (blue) populations determined in [25].

