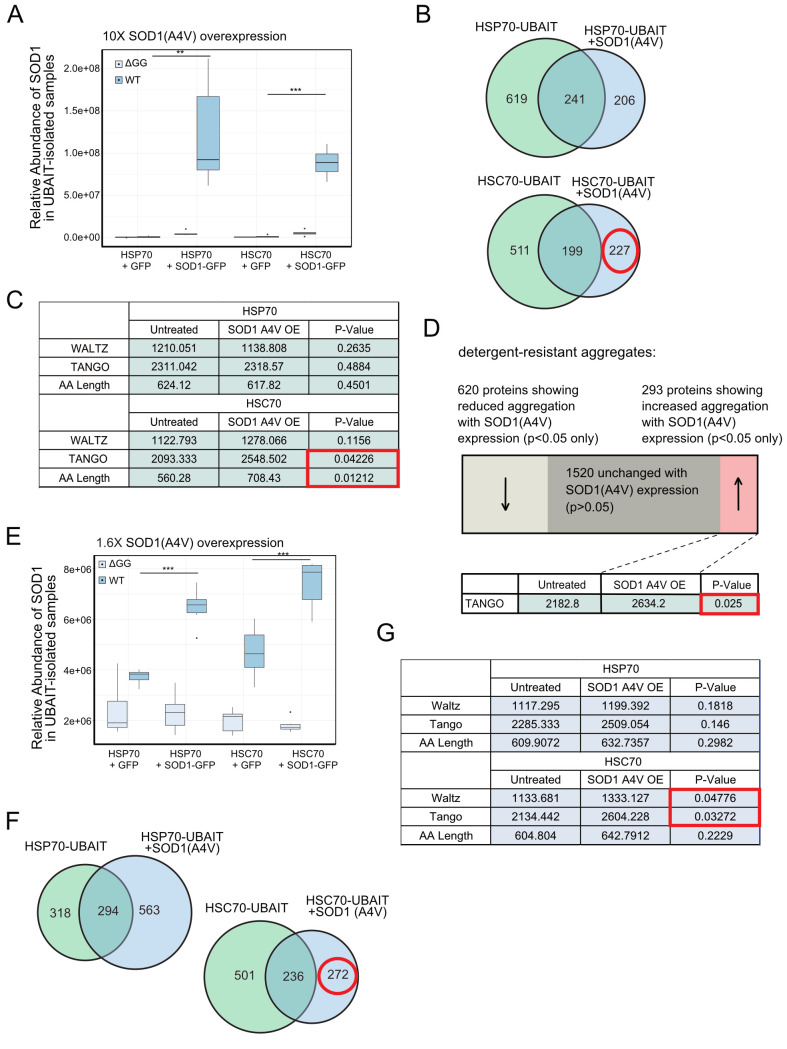
Fig 4. Expression of a misfolded protein changes the landscape of HSC70 binding partners.
(A) HSP70 and HSC70 UBAIT isolations were performed in U2OS cells with either GFP or SOD1(A4V)-P2A-GFP high-level overexpression (N = 6); levels of SOD1 associated with HSP70 or HSC70 UBAITs were measured using label-free quantification. (B) Venn diagrams showing proteins identified as enriched with either HSP70 or HSC70 UBAITs; red circle indicates targets gained with SOD1(A4V) expression in HSC70 UBAIT cells. (C) Summary of average WALTZ [47] and TANGO [46] scores as well as polypeptide length of proteins enriched with UBAITs in cells expressing GFP or SOD1(A4V)-P2A-GFP. Welch’s t test was used to compute p-values, and red box indicates significant p-values corresponding to targets gained with SOD1(A4V) expression in HSC70 UBAIT cells. (D) Detergent-resistant protein aggregates were isolated and analyzed by mass spectrometry from UBAIT-expressing cells with either GFP or SOD1(A4V) expression (N = 3). Summary of proteins identified that increased, decreased, or were statistically indistinguishable in aggregate fraction with SOD1(A4V) expression. Welch’s t test was used to compute p-values. (E) HSP70 and HSC70 UBAIT isolations were performed as in (A) but with lower-level overexpression (approximately 2-fold compared with endogenous)(N = 6). Levels of SOD1 associated with HSP70 or HSC70 UBAITs were measured using label-free quantification. (F) Venn diagrams showing proteins identified as enriched with either HSP70 or HSC70 UBAITs. (F) Summary of average WALTZ [47] and TANGO [46] scores as well as polypeptide length of proteins enriched with UBAITs in cells expressing GFP or SOD1(A4V)-P2A-GFP. Welch’s one-tailed t test was used to compute p-values, and red box indicates significant p-values corresponding to targets gained with SOD1(A4V) expression in HSC70 UBAIT cells. See also S6 Data. AA, amino acid; GFP, green fluorescent protein; HSC, heat shock congnate; HSP, heat shock protein; OE, overexpressed; SOD1, superoxide dismutase 1; UBAIT, ubiquitin-activated interaction trap; WT, wild-type.

