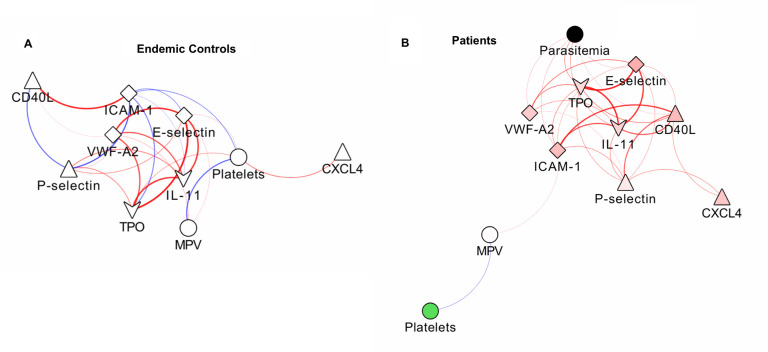
Fig 3. Correlation between markers of platelet and endothelial cell activation.
Networks of the correlations between platelet parameters and markers of endothelial cell activation in controls (A) and patients (B), using a prefuse force-directed layout done in Cytoscape software (v 3.5.1). The symbols of the nodes represent biological functions of the molecules presented, triangle represents markers of platelet activation, V shape represents markers of thrombopoiesis, diamond represent endothelial cell activation markers and the circles clinical parameters such as platelets, mean platelet volume and parasitemia. The colors in the nodes represent the fold change in relation to control levels. Because endemic controls do not have parasitemia, the node is represented in black. Each connecting line (edge) represents a significant interaction detected by the network analysis using the R software. Correlation strength is represented by edge color transparency and width. Positive correlations are represented by red edges and negatives correlations are represented by blue edges.

