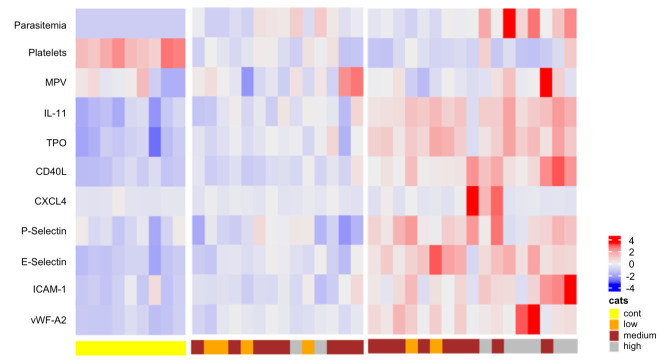
Fig 4. Heatmap of analyte expression.
The heatmap represents z-scores obtained by centering variables (parasitemia, platelet parameters and markers of endothelial cell activation) with the Scale() Function in R, followed by hierarchical and k-means clustering analysis, showing three distinct clusters of controls and two groups of patients. Yellow: Controls; Orange: low parasitemia; Brown: moderate parasitemia; Gray: high parasitemia.

