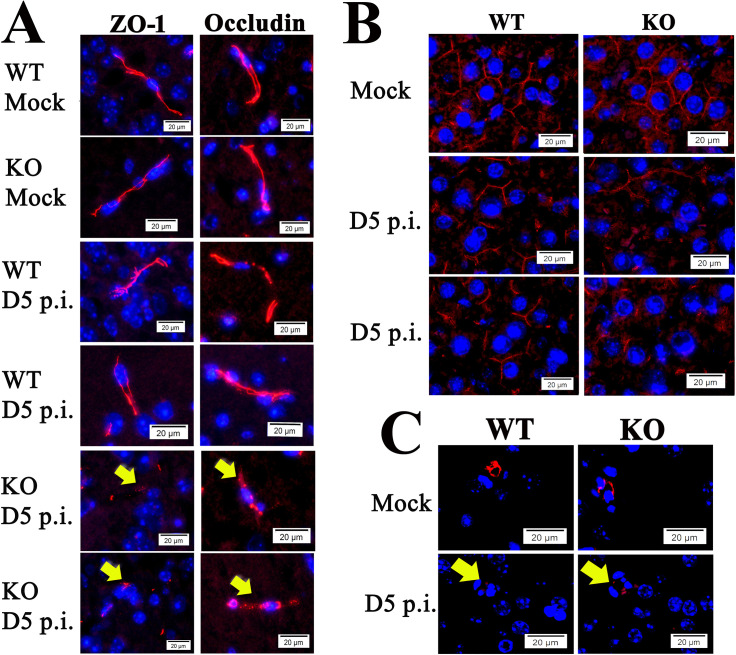
Fig 8.
(A) Representative IF staining of ZO-1 (left) and occludin (right) in the brains from R.australis/mock-infected/ WT and ANXA2-KO mice, at day 5 p.i.. Yellow arrows indicate the fragmented structures of ZO-1 and occludin, which were mainly seen in infected ANXA2-KO mice. (B) Representative IF staining for occludin in the livers from R.australis/mock-infected/ WT and ANXA2-KO mice, at day 5 p.i.. (C) Representative IF for VE-cadherin in the brains from R.australis/mock-infected/ WT and ANXA2-KO mice, at day 5 p.i. Yellow arrows indicate the fragmented structures of VE-cadherin. Nuclei of mouse cells were counterstained with DAPI (blue). Scale bar: 20um.

