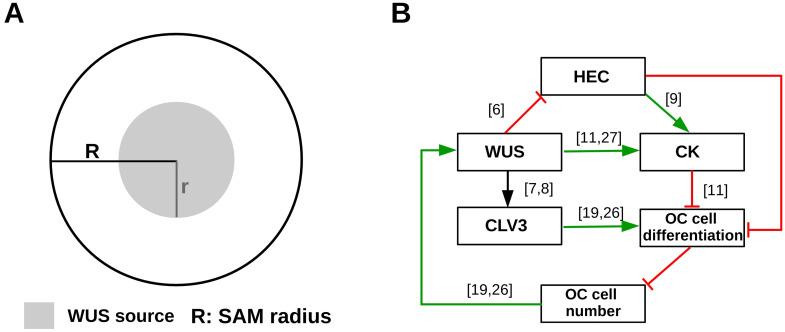
Fig 2. Overview of SAM geometry and regulatory feedbacks.
(A) The SAM is modelled as a disc of radius R. The domain where WUS is produced is modelled as a concentric disc of radius r. (B) Regulatory signals: activating feedbacks are indicated in green, inhibiting feedbacks are indicated in red. The depicted interaction network functions at each position of the meristem. The expression domains of the respective factors evolve dynamically as a result of the interaction network, the initial condition and the diffusion of the factors. The number of OC cells determines the radius r. The OC is located below the SAM. The numbers in brackets correspond to the references on which the respective interaction is based.

