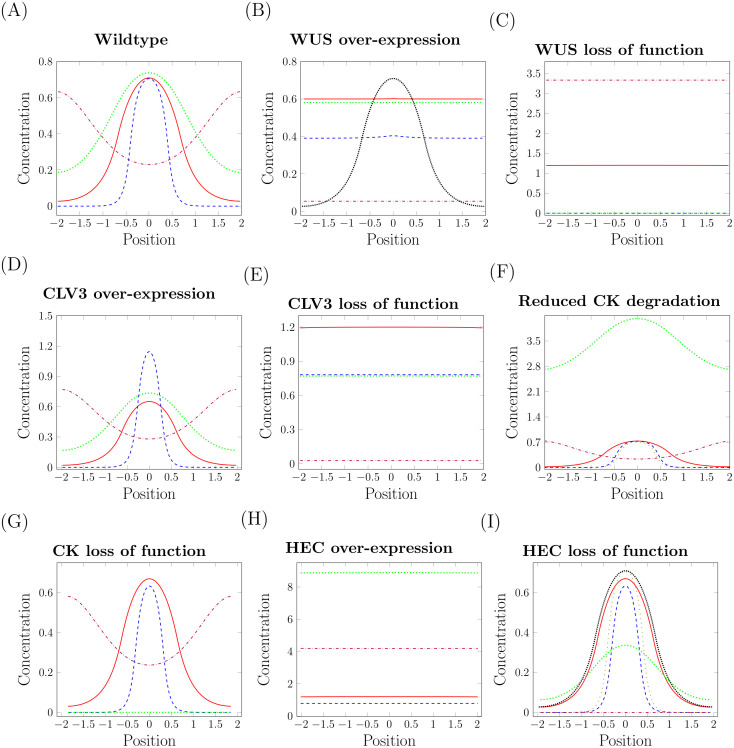
Fig 3. Signal concentrations in over-expression and loss-of-function experiments.
Signal concentrations along the diameter of the meristem, position 0 corresponds to the center: WUS (solid red), CLV3 (dashed blue), CK (dotted green) and HEC (dashdotted purple). (A) Unperturbed steady-state of the wild-type meristem. (B) Ubiquitous over-expression of WUS: The system converges to a state with CLV3 expression in the whole meristem. The equilibrium concentration of WUS in the wild-type is shown for comparison (densely dotted black). (C) WUS loss of function: The system converges to a steady-state with negligible CLV3 concentrations, which corresponds to the experimentally observed loss of stem cells. Breakdown of the negative feedback between WUS and CLV3 leads to high concentrations of WUS molecules that are not functional. (D) CLV3 over-expression: The system converges to a state with higher CLV3 and slightly reduced WUS concentrations. (E) CLV3 loss of function: Due to the missing negative feedback the OC expands and the CZ spreads over the whole meristem. (F) Reduced degradation of CK: The system converges to a state with constant in space signal concentrations. For comparison the CLV3 profile of the wild-type steady-state is depicted (loosely dotted olive). (G) CK loss of function does not lead to significant changes in the simulations. (H) HEC over-expression in stem cells: The central zone expands until it reaches the boundary of the meristem. (I) HEC loss of function (so called HEC triple mutant): The system converges to a state with lower WUS and CLV3 concentrations and a smaller meristem. HEC concentration (dashdotted purple) is equal to zero. For comparison, the CLV3 (loosely dotted olive) and WUS (densely dotted black) profiles of the wild-type steady-state are depicted.

