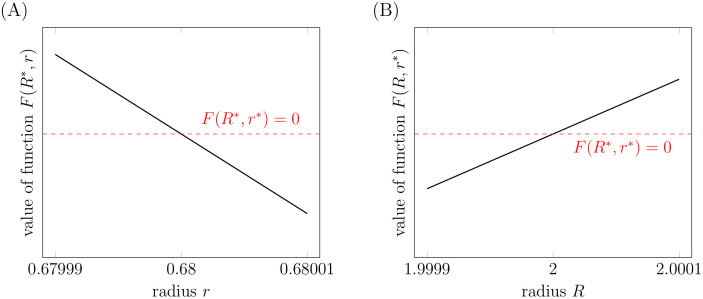
Fig 6. Local stability of the steady state.
Both plots present values of the function F(R, r). In (A) we set R = R*, in (B) we set r = r*. The dashed red lines correspond to F(R*, r*) = 0. All calculations were done for mesh size N = 50 (90404 degrees of freedom). Also the value F(R*, r*) is calculated using the value of pdbasic corresponding to the mesh size N = 50.

