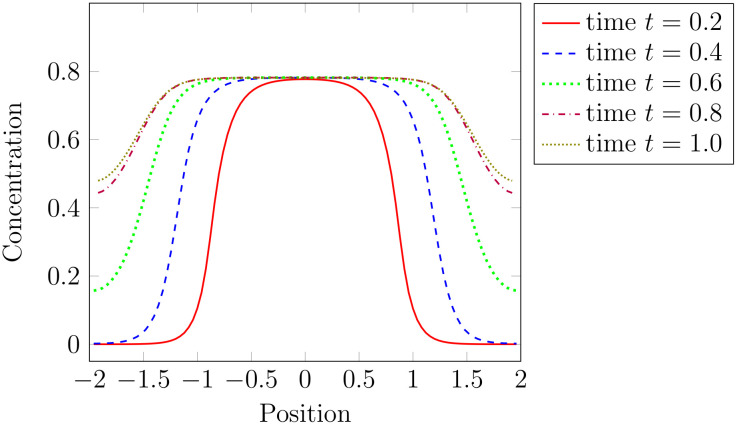
Fig 7. Time dynamics of CLV3 over-expression.
Numerical calculation of CLV3 concentration for different time points after induction of ubiquitous WUS over-expression with c = 2.9: red solid for time t = 0.2, dashed blue for time t = 0.4, dotted green for time t = 0.6, dashdotted purple for time t = 0.8 and densely dotted olive time t = 1. As observed in experiments [41] the zone of high CLV3 expression extends in radial direction.

