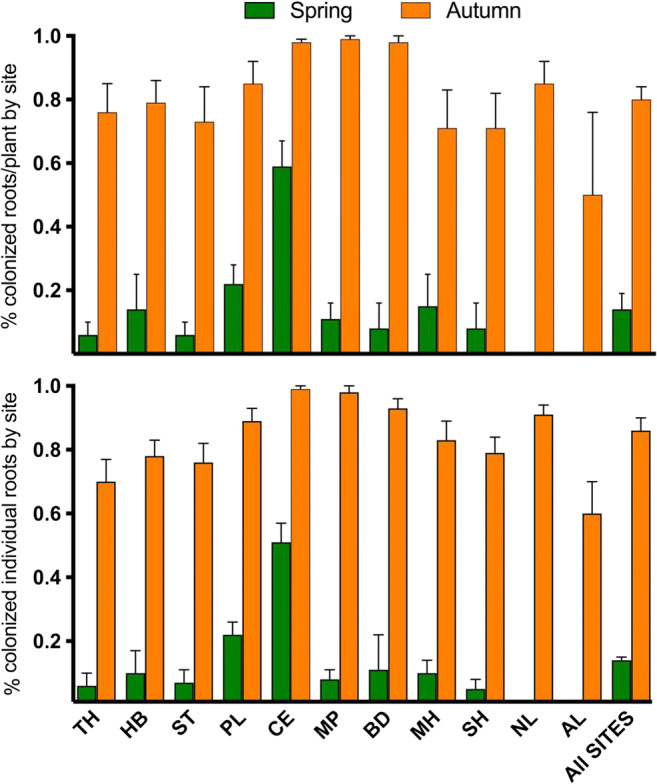
Fig. 2.

Comparison of spring and autumn 2019 roots colonized by fine root endophytes across all sites. (Top) percentage of colonized individual roots by site (two-way ANOVA, season: F(1,1258) = 5101, p < 0.0001; site: F(9,1258) = 262.2, p < 0.0001). (Bottom) percentage of colonized individual roots per plant by site (two-way ANOVA, season: F(1, 251) = 247, p < 0.0001; site: F(9251) = 255, p < 0.0001). Values for n for each site are shown in Supplemental Table 2. Error bars ± SE. There are no bars in spring for both Aldershot (AL) (n = 2 roots) and Netherlands (NL) (n = 109 roots) as they had no colonized roots. The graph uses raw percentage data while the two-way ANOVA results reflect logit-transformed data (Table 2). Abbreviations of site names are detailed in Supplemental Table 1
