. 2020 Jul 29;2(4):e200048. doi: 10.1148/ryai.2020200048

Figure 6a.

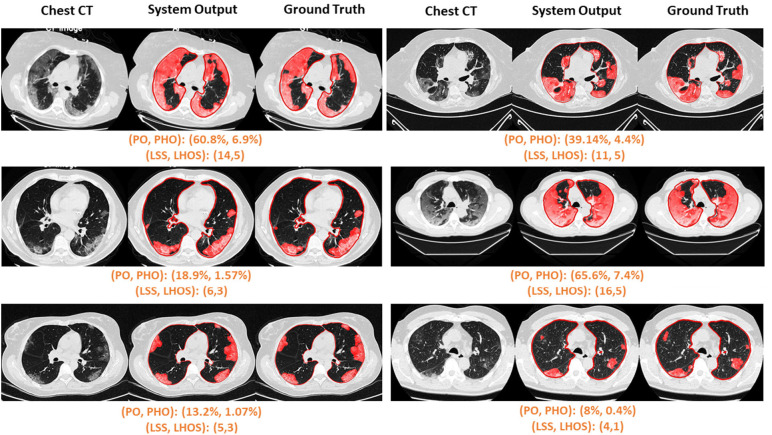
Visualization of segmented abnormality regions. (a) Combined severity measures (PO, PHO) and (LSS, LHOS) computed for six successful cases. (b) Shows the same result side by side for abnormality segmentation, and just the high opacity segmentation. (c) Shows some of the outliers of the system.

Visualization of segmented abnormality regions. (a) Combined severity measures (PO, PHO) and (LSS, LHOS) computed for six successful cases. (b) Shows the same result side by side for abnormality segmentation, and just the high opacity segmentation. (c) Shows some of the outliers of the system.