Figure 4.
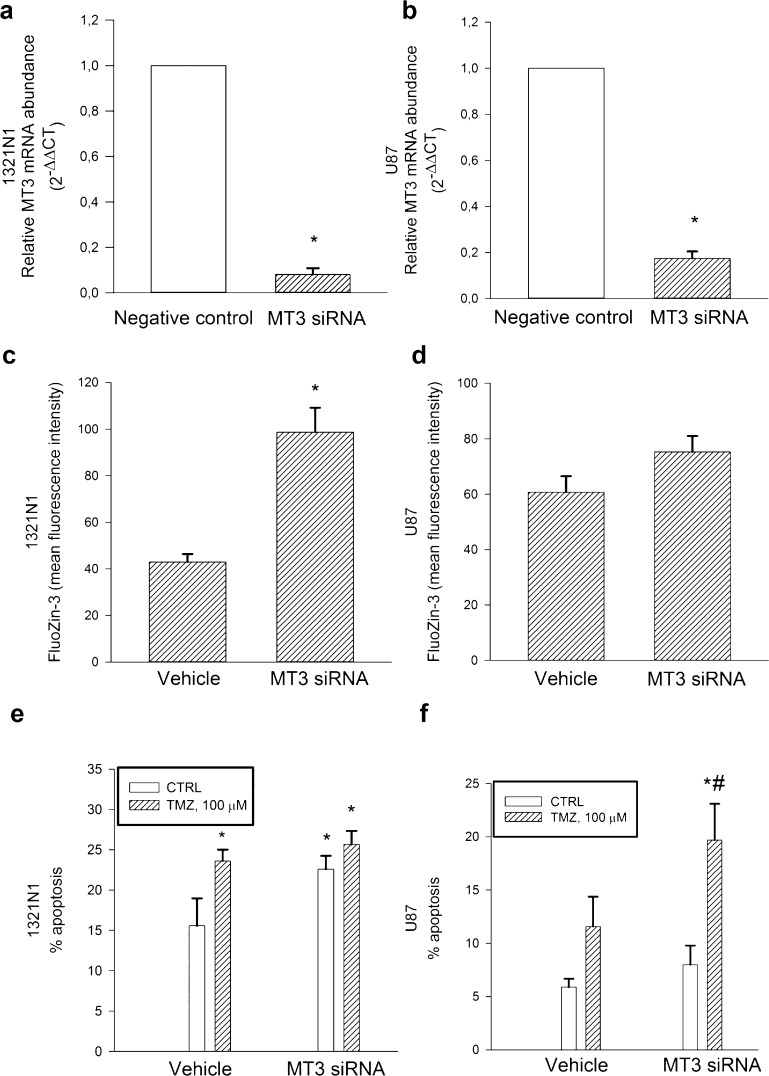
MT3 mRNA levels in 1321N1 (a) and U87 glioma cells (b), which were silenced for 72 h before qRT-PCR analysis. Relative quantification of mRNAs (2–ΔΔCT method) was performed by using 18S rRNA as a reference gene. Bars represent the means ± SEM of 3–8 determinations. *P < 0.05 vs the silencer negative control. Mean fluorescence intensity of the zinc dye, FluoZin-3, in 1321N1 (c) and in U87 glioma cells (d) that were silenced for 72 h. Bars represent the means ± SEM of 6–8 determinations. *P < 0.05 vs vehicle. Percentage of apoptosis in MT3-silenced 1321N1 (e) and U87 glioma cells (f) either in the absence or in the presence of TMZ (100 μM) for 96 h. Bars represent the means ± SEM of 4 determinations. P < 0.05 vs *CTRL or #TMZ alone.

